

Design data you can
‍
quote

Sourced benchmarks on SaaS design budgets, salaries and ROI. Every figure is checked at its primary source and dated, so you can cite it.

All reports

Numbers with a publisher, a date and a sample size behind them.

Thank you! Your submission has been received!
Oops! Something went wrong while submitting the form.
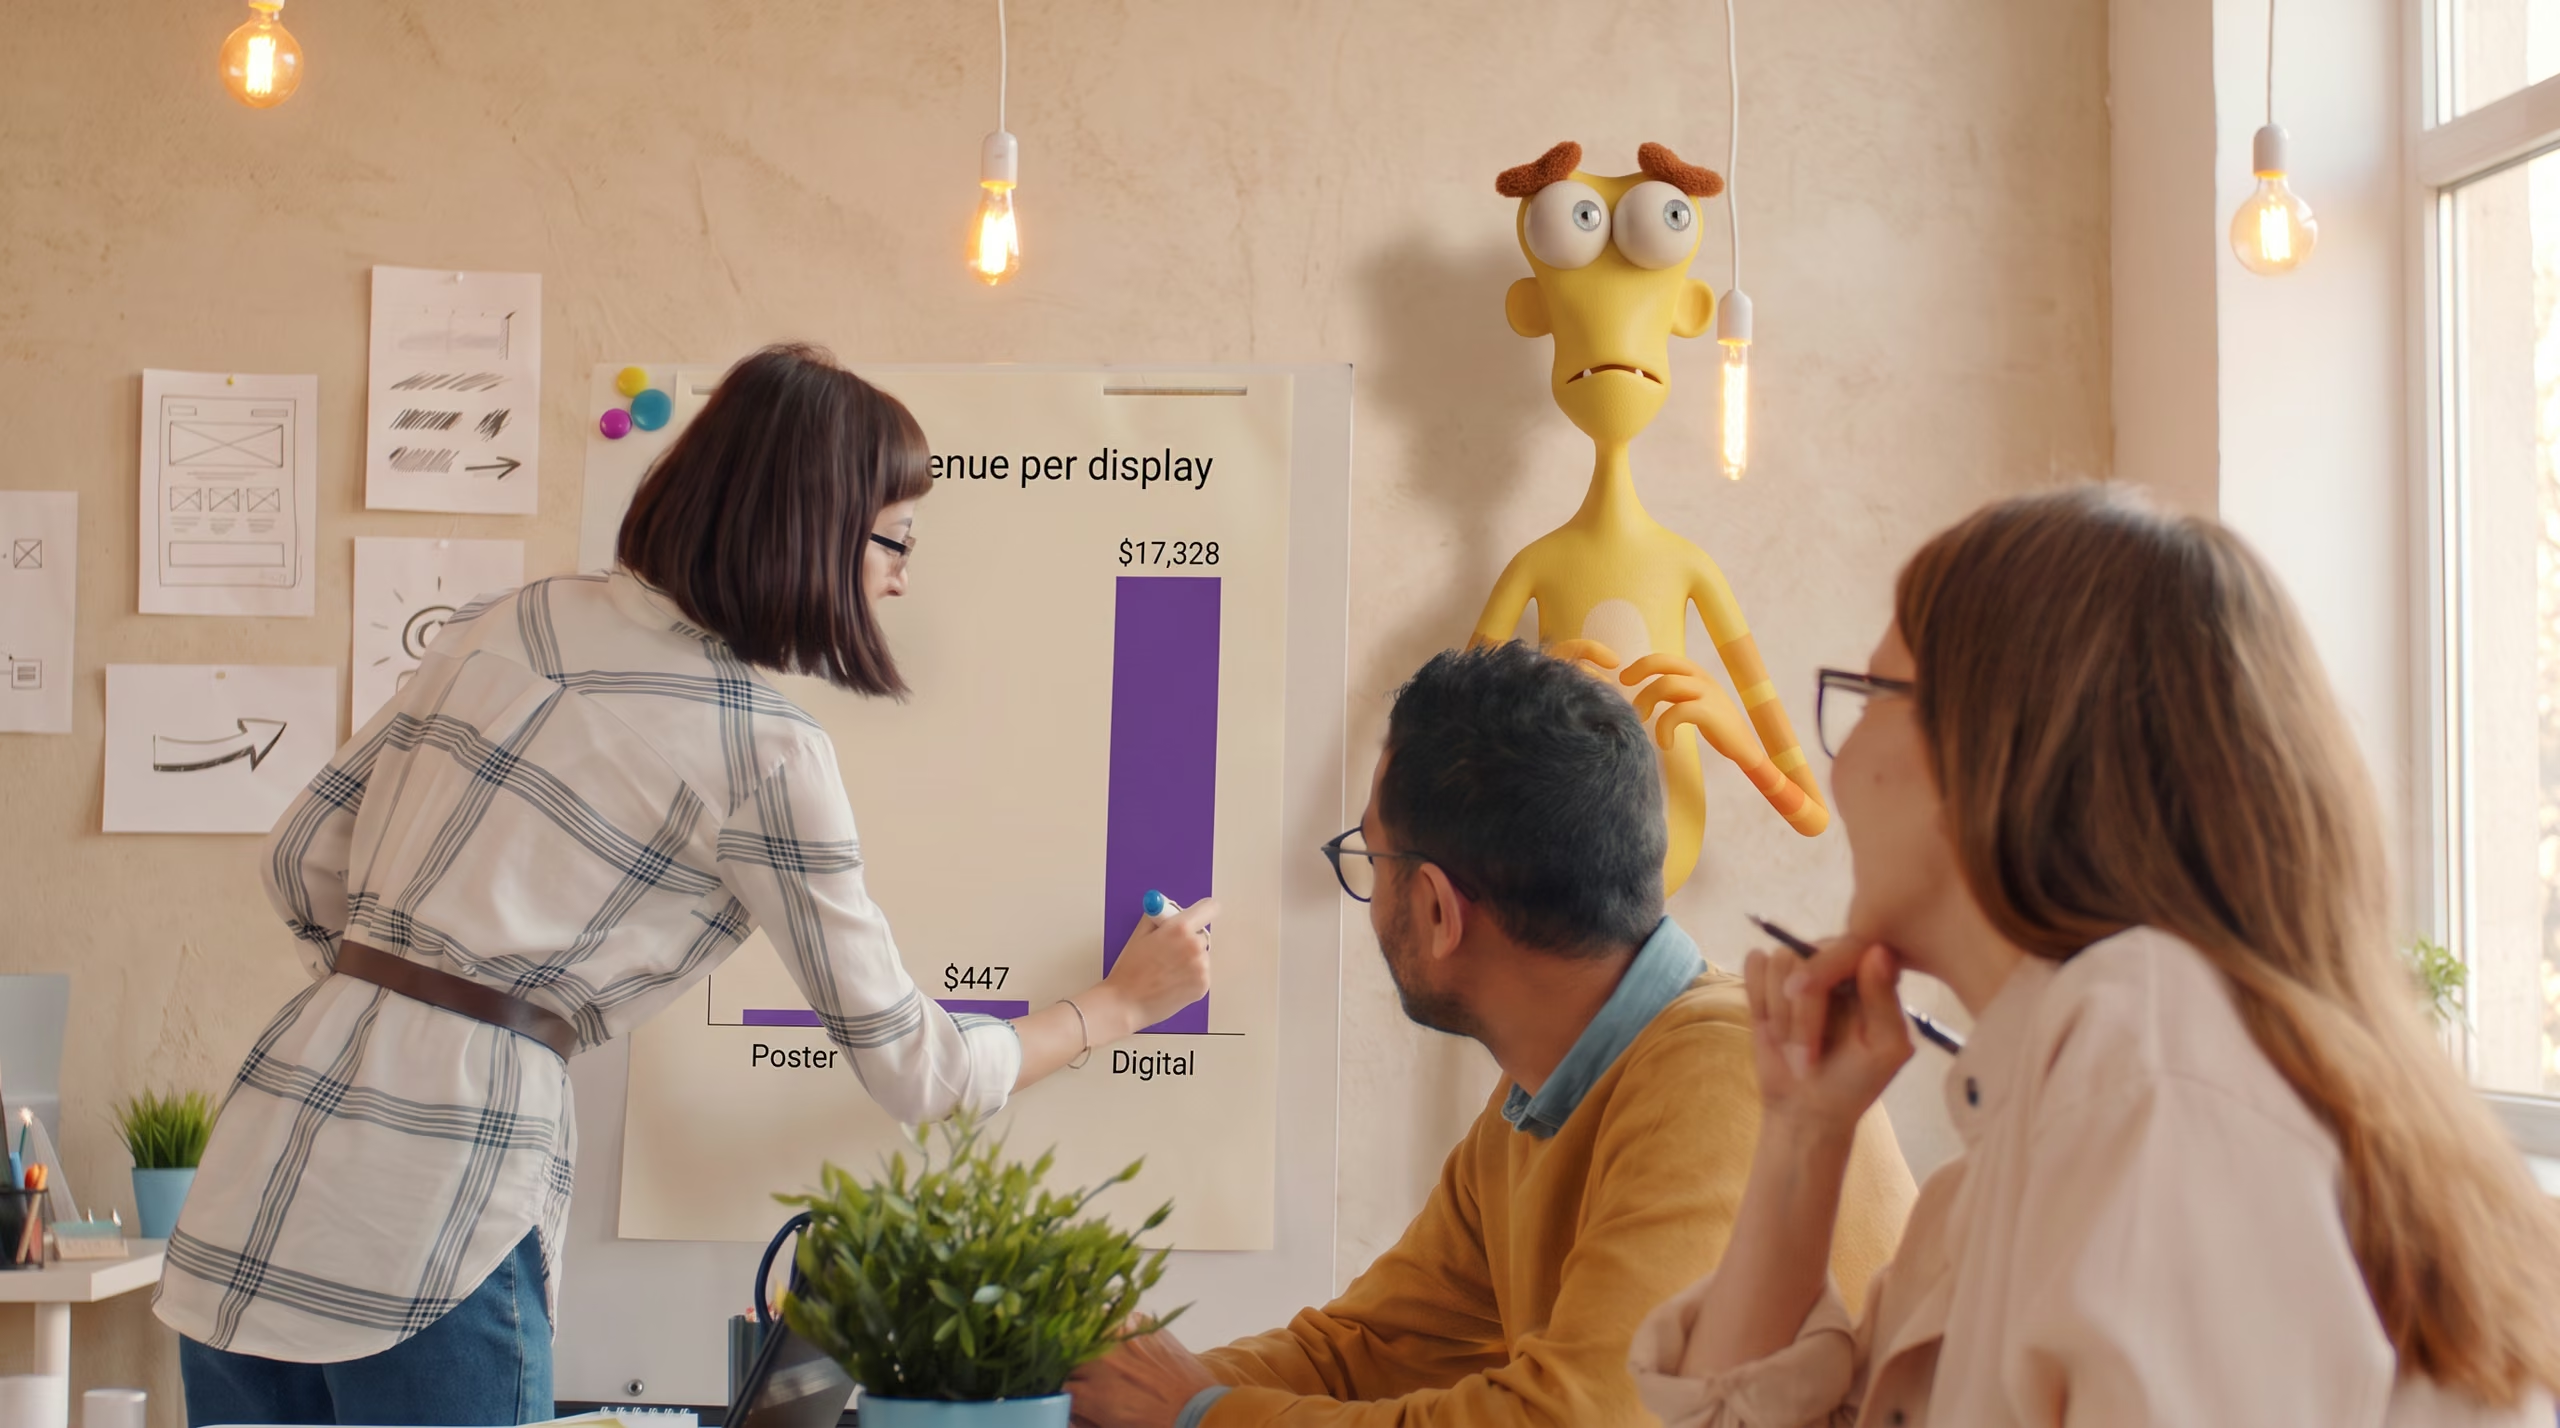
Three colleagues in a sand-plaster meeting room look at a flipchart reading Revenue per display, with a $447 poster bar beside a $17,328 digital bar, while a tall yellow monster stands against the wall behind them wringing his hands.
Product & UX
19
min read

How Much Does a Billboard Cost? $447 to $17,328

Billboard advertising cost by type: $447 to $2,028 per four-week period for a static billboard, $8,834 to $17,328 for digital. From 2025 SEC filings.

A designer at his laptop in a modern studio, with a wall poster splitting the fully loaded $89,951 cost of a graphic designer into wages and employer benefits, and Grizzle watching from a stool.
Product & UX
10
min read

Graphic Design Prices: $699 to $12,490 a Month

Graphic design prices in the US run $699 to $12,490 a month ongoing, $100 to $161 an hour at agencies, $40 a job freelance. Sourced table by route.
Bluster, a big dark-teal furry Cluma monster, presents a revenue growth chart showing +32% for top-quartile design companies to a colleague in a warm, sunlit meeting room
Product & UX
9
min read

McKinsey Design Index: The Business Value of Design

What the McKinsey Design Index measures, and the business value of design it found: the top quartile grew revenue 32 percentage points faster than peers.
In a warm, sunlit meeting room, Grizzle sits with crossed arms behind two fallen glass bars, Mumble hovers watching, and Noodle measures a standing purple bar with a tape measure
Product & UX
10
min read

UX Statistics 2026: Salary, SaaS Spend, Design ROI

Sourced UX statistics and design statistics for 2026: median UX salary $120,000, an average 83% lift from usability work, SaaS R&D at 22% of ARR.

A woman and a man at a walnut desk look at a pinboard of sketches while the monster Giggles holds up a chart of graphic designer jobs showing a 2 percent decline between the 2024 and 2025 BLS projection cycles.
Product & UX
18
min read

Will AI Replace Graphic Designers? Not in 10 Years

Will AI replace graphic designers? Not within ten years: BLS projects a 2 percent decline to 2035 and still expects designers for layouts and branding.
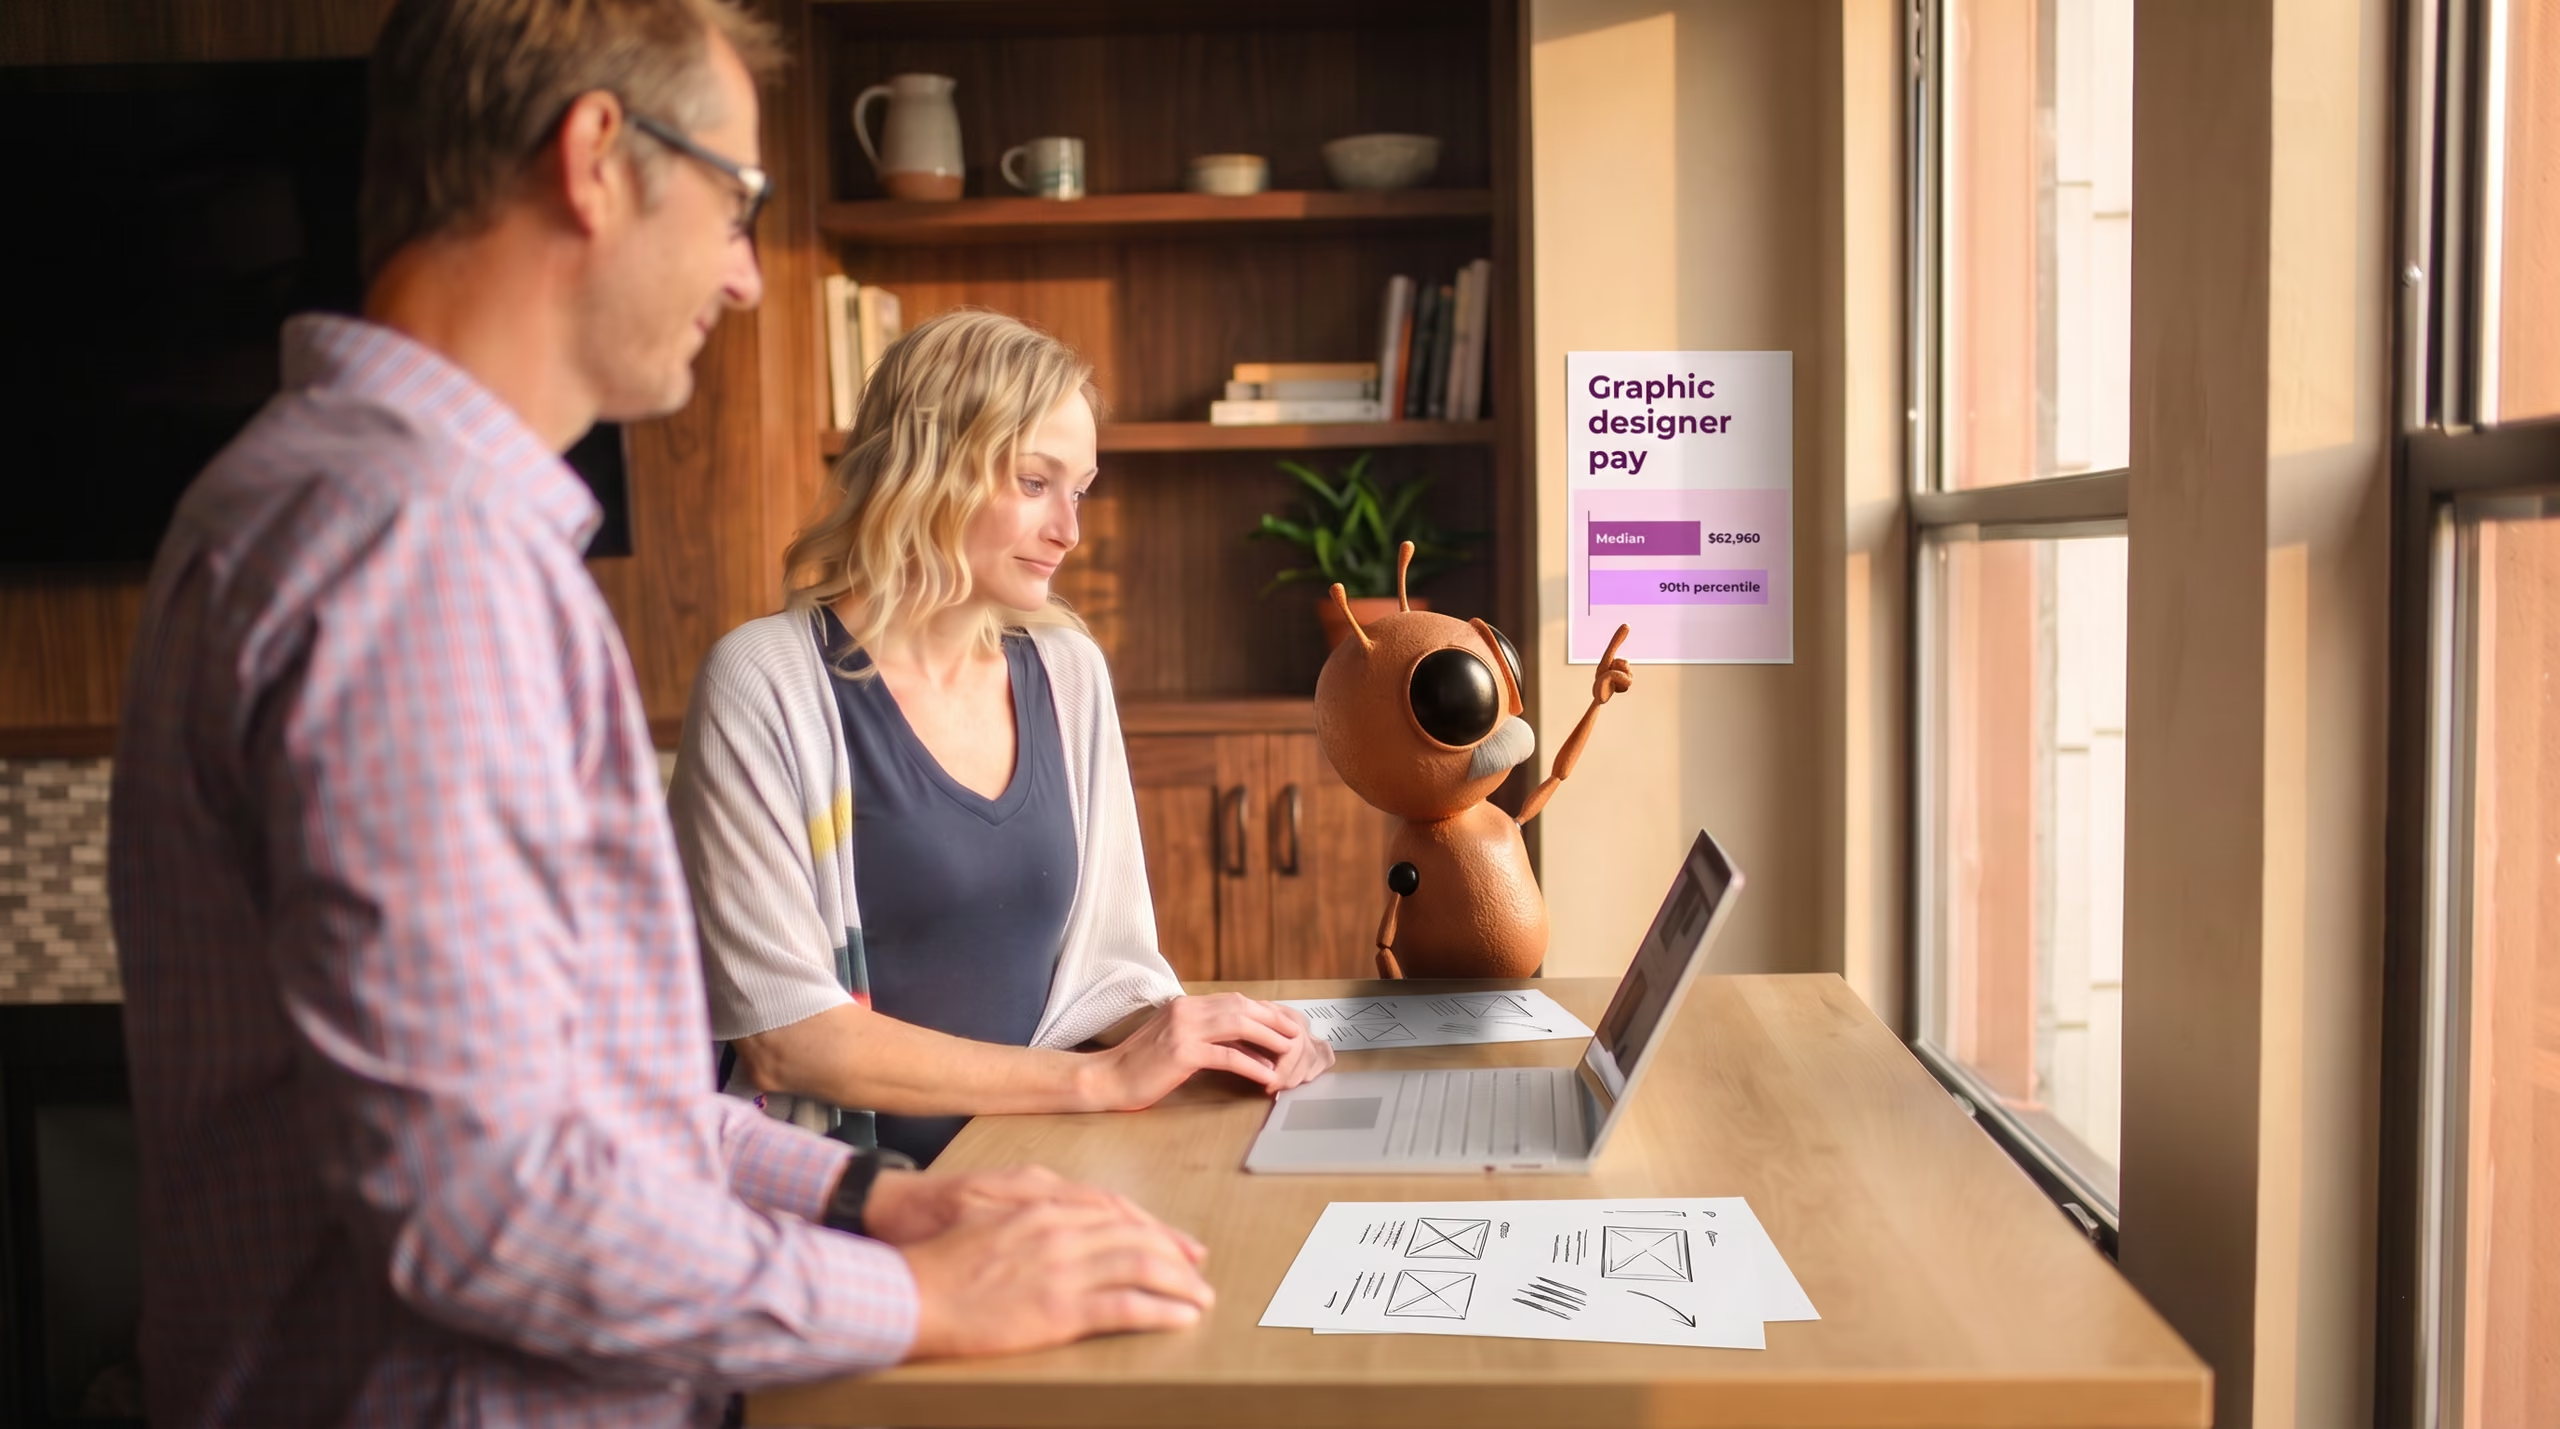
Two colleagues at a standing desk in a warm walnut office look at a laptop while the monster Blink points up at a printed chart of graphic designer pay showing a median of $62,960.
Product & UX
16
min read

Graphic Designer Salary: $30.27/Hour, $62,960/Year

The median graphic designer salary is $62,960 a year, $5,247 a month and $30.27 an hour. Full percentile bands in all three units, plus employer cost.
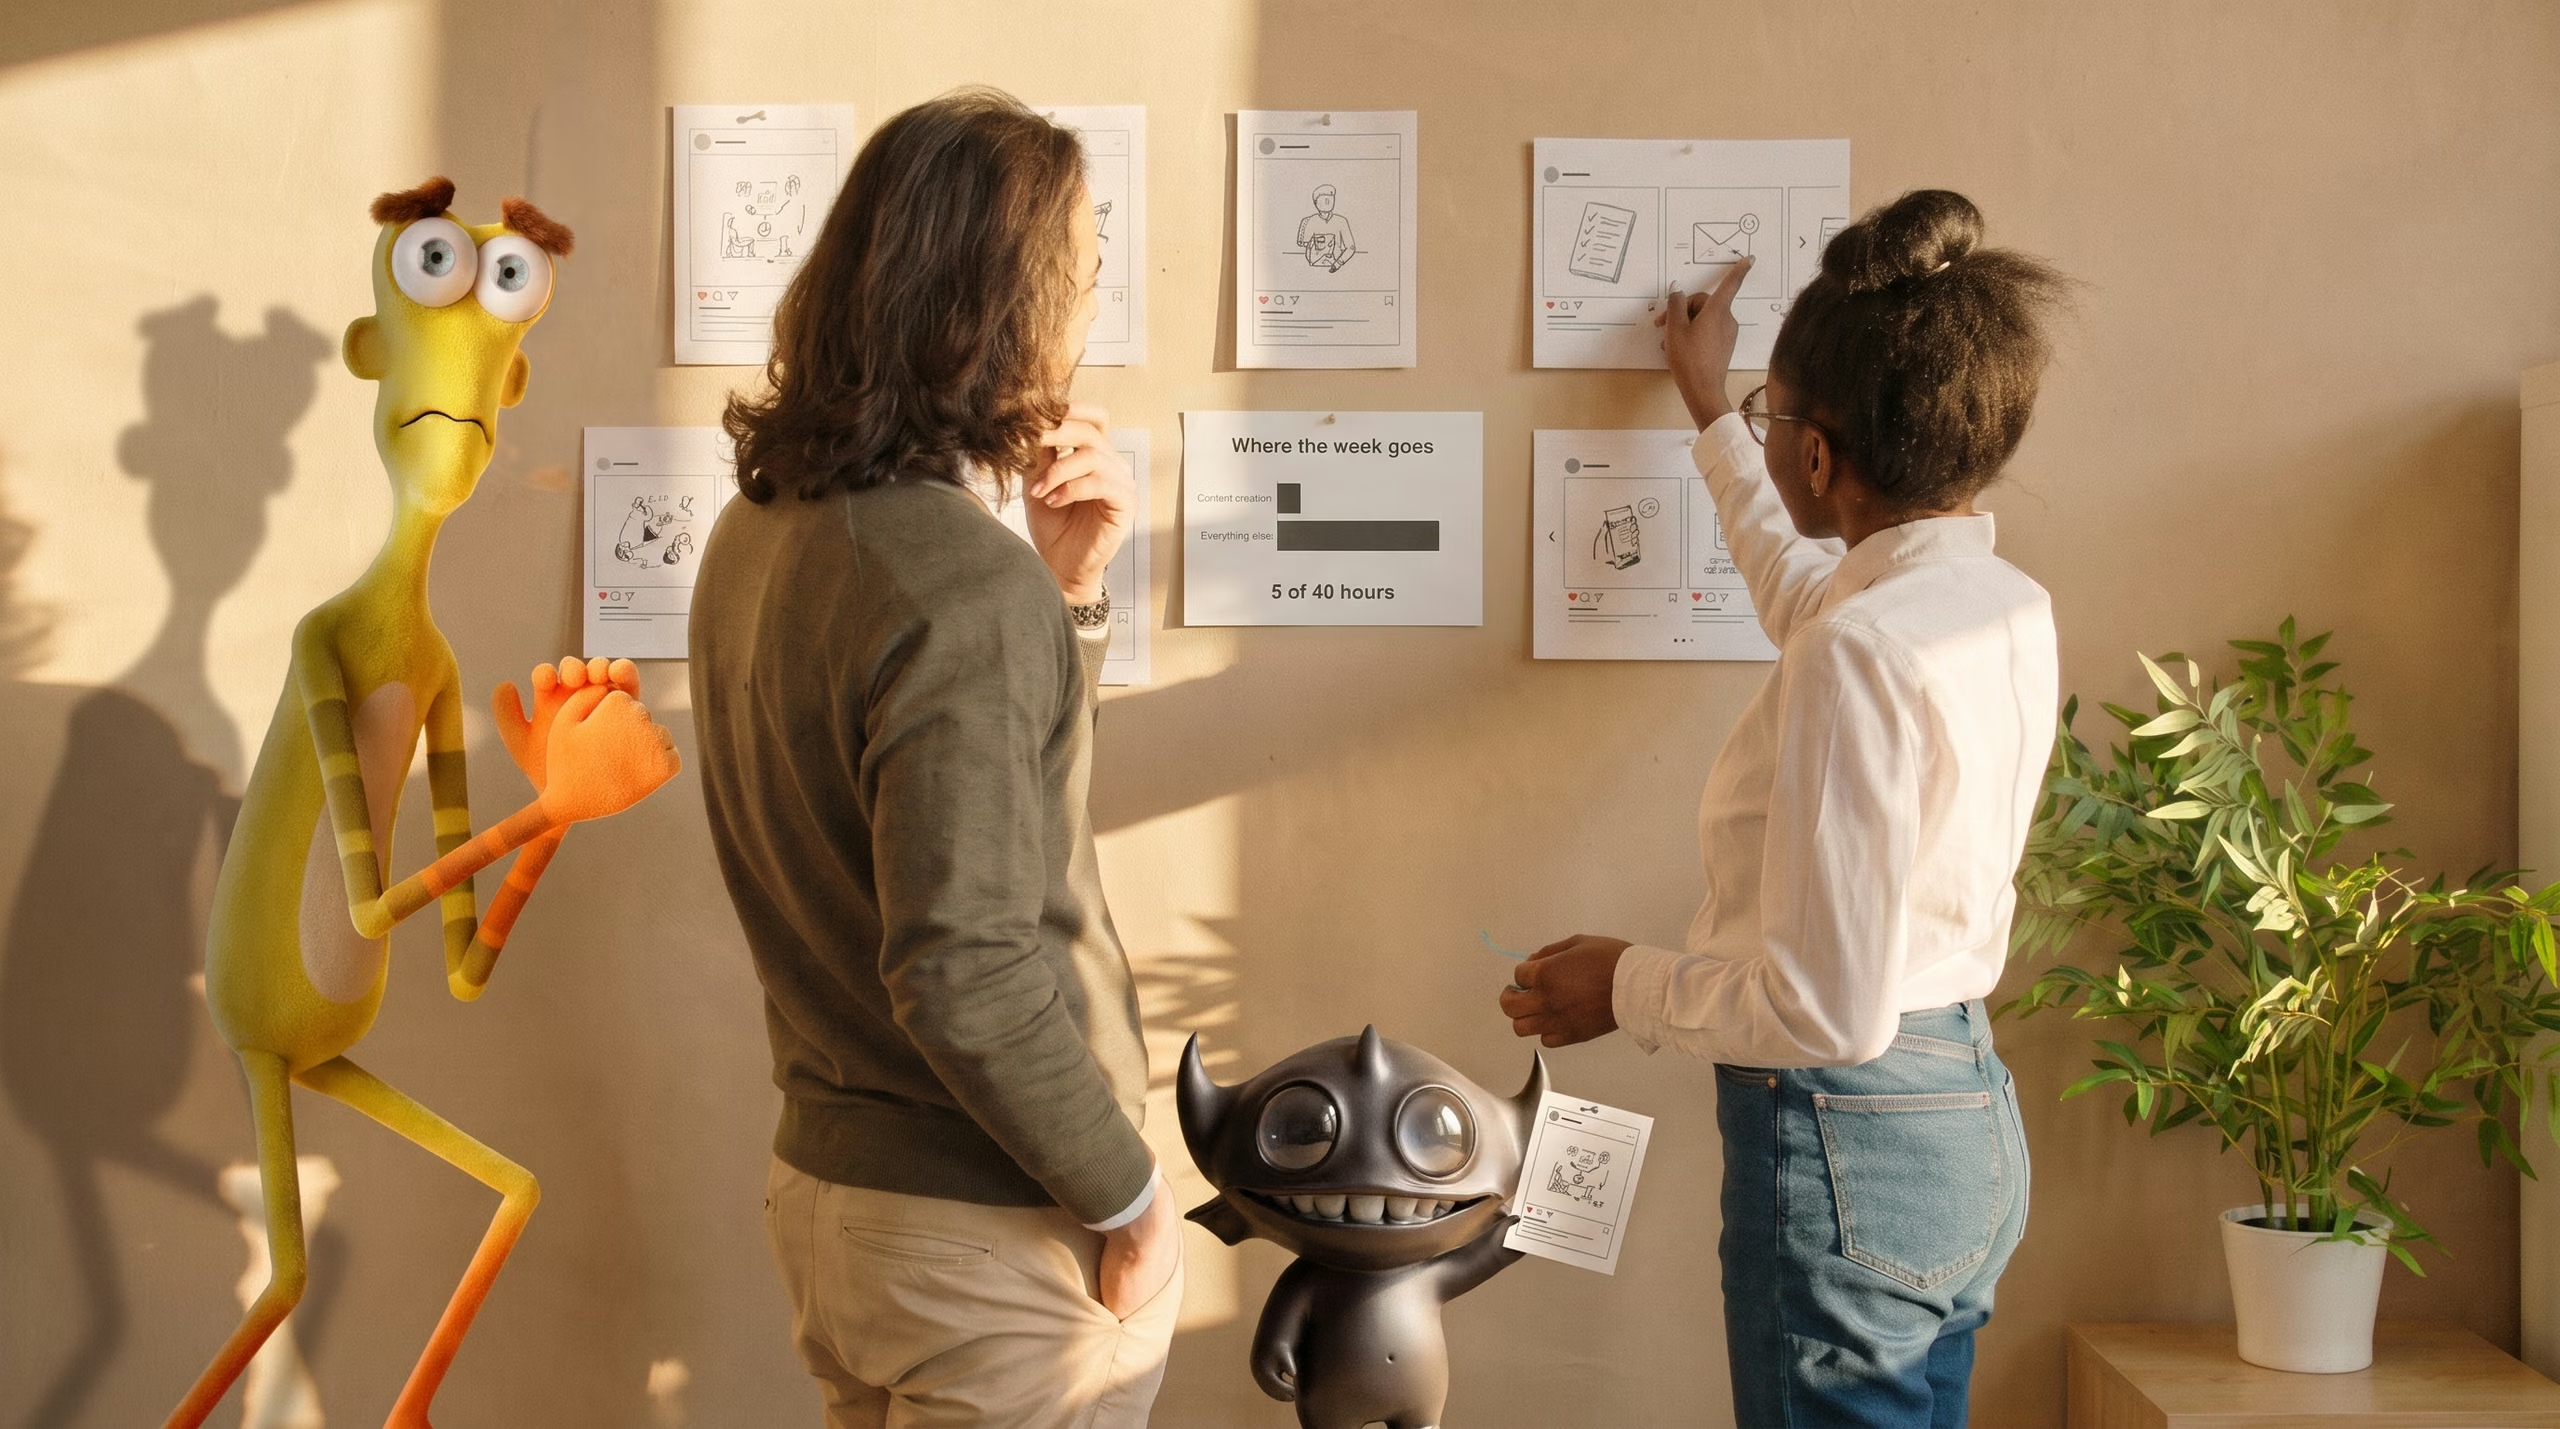
Two colleagues in a warm modern office pin printed social post mockups and a printed chart reading 5 of 40 hours to the wall, while the monster Noodle wrings his hands beside them and the monster Giggles holds up a finished carousel page.
Product & UX
15
min read

Social Media Manager Salary 2026: What Employers Pay

The best-sourced social media manager salary is the BLS median of $74,750 a year. A hire costs an employer about $106,795 once benefits are on top.

Four colleagues at a monitor in a warm office, a pinned week grid behind them with Tuesday, Wednesday and Thursday hours circled and two of three marked, and Nervous Noodle at the desk.
Product & UX
13
min read

Best Time to Post on LinkedIn: 3 Studies Compared

Best time to post on LinkedIn, compared across Buffer, Hootsuite and Sprout Social: the hours they agree on, the hours they do not, and what to do.
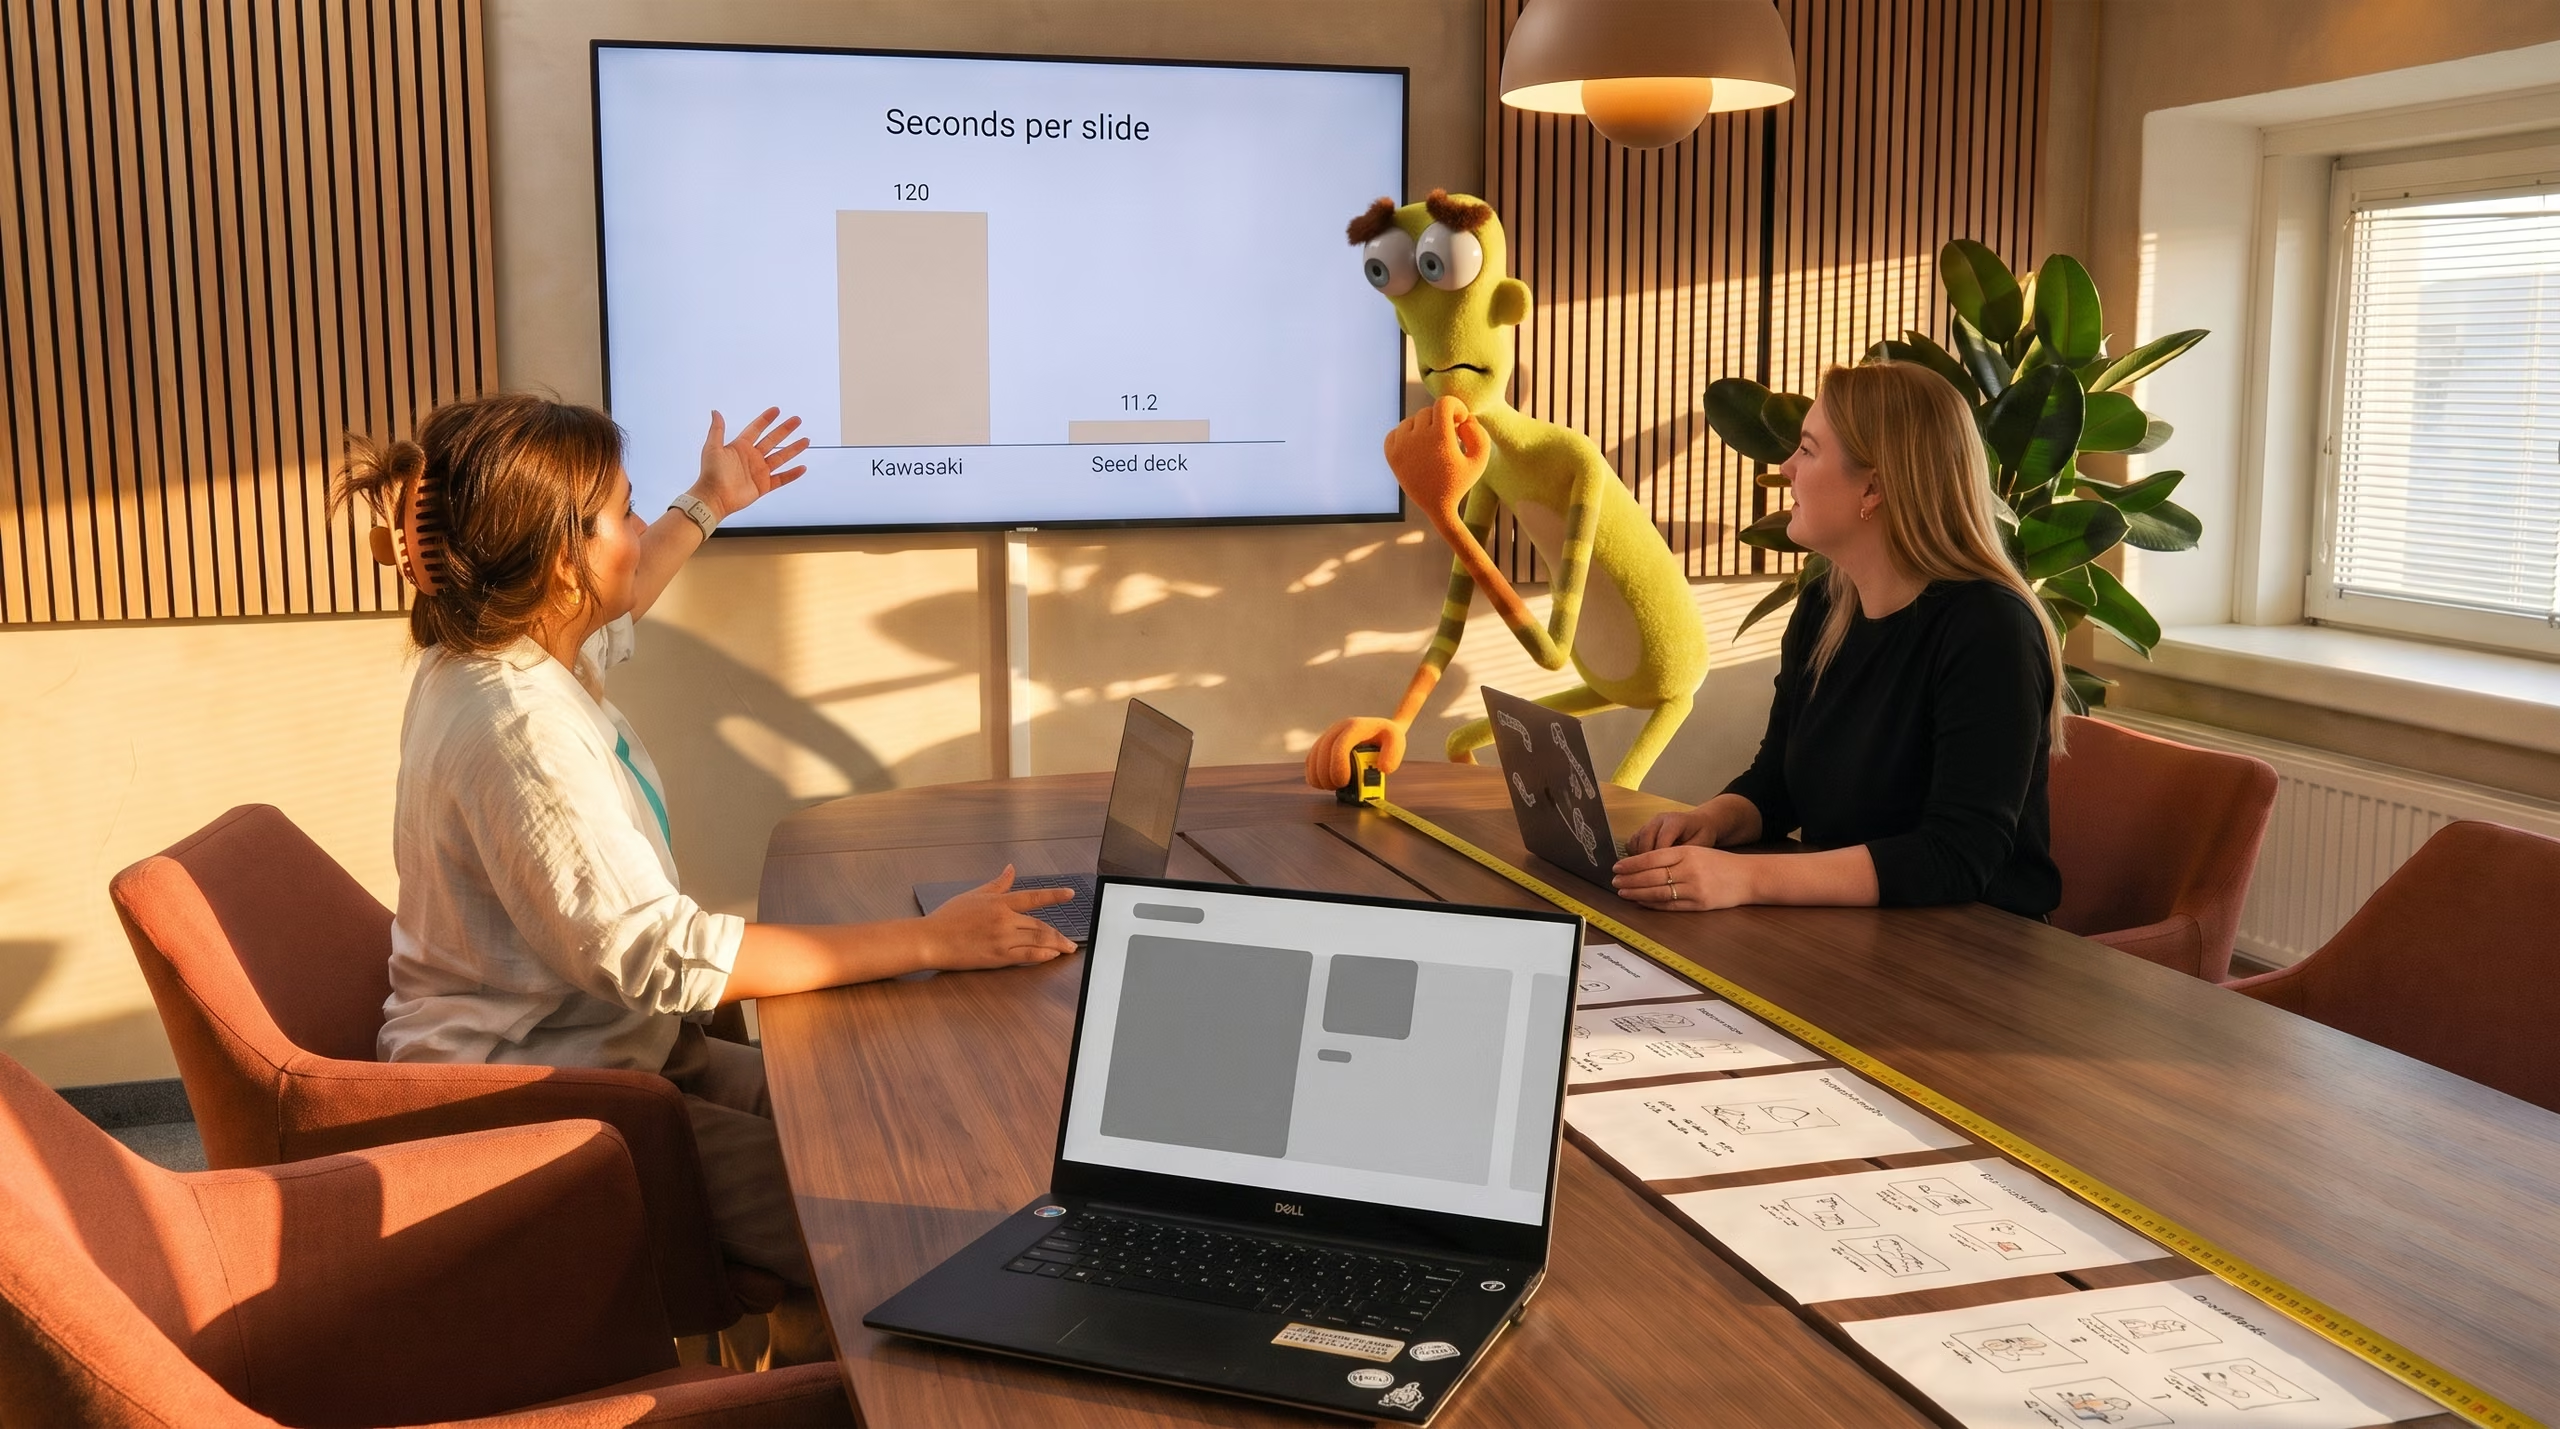
Two women in a warm meeting room look at a wall screen showing a Seconds per slide chart with bars at 120 for Kawasaki and 11.2 for a seed deck, while a tall yellow monster leans on the walnut table holding a tape measure laid along a row of printed slides.
Product & UX
15
min read

The 10/20/30 Rule: 10 Slides vs 20 in Seed Decks

The 10/20/30 rule says ten slides, twenty minutes, thirty-point font. DocSend measures seed decks at 20 slides and 3 minutes 44 seconds of VC attention.
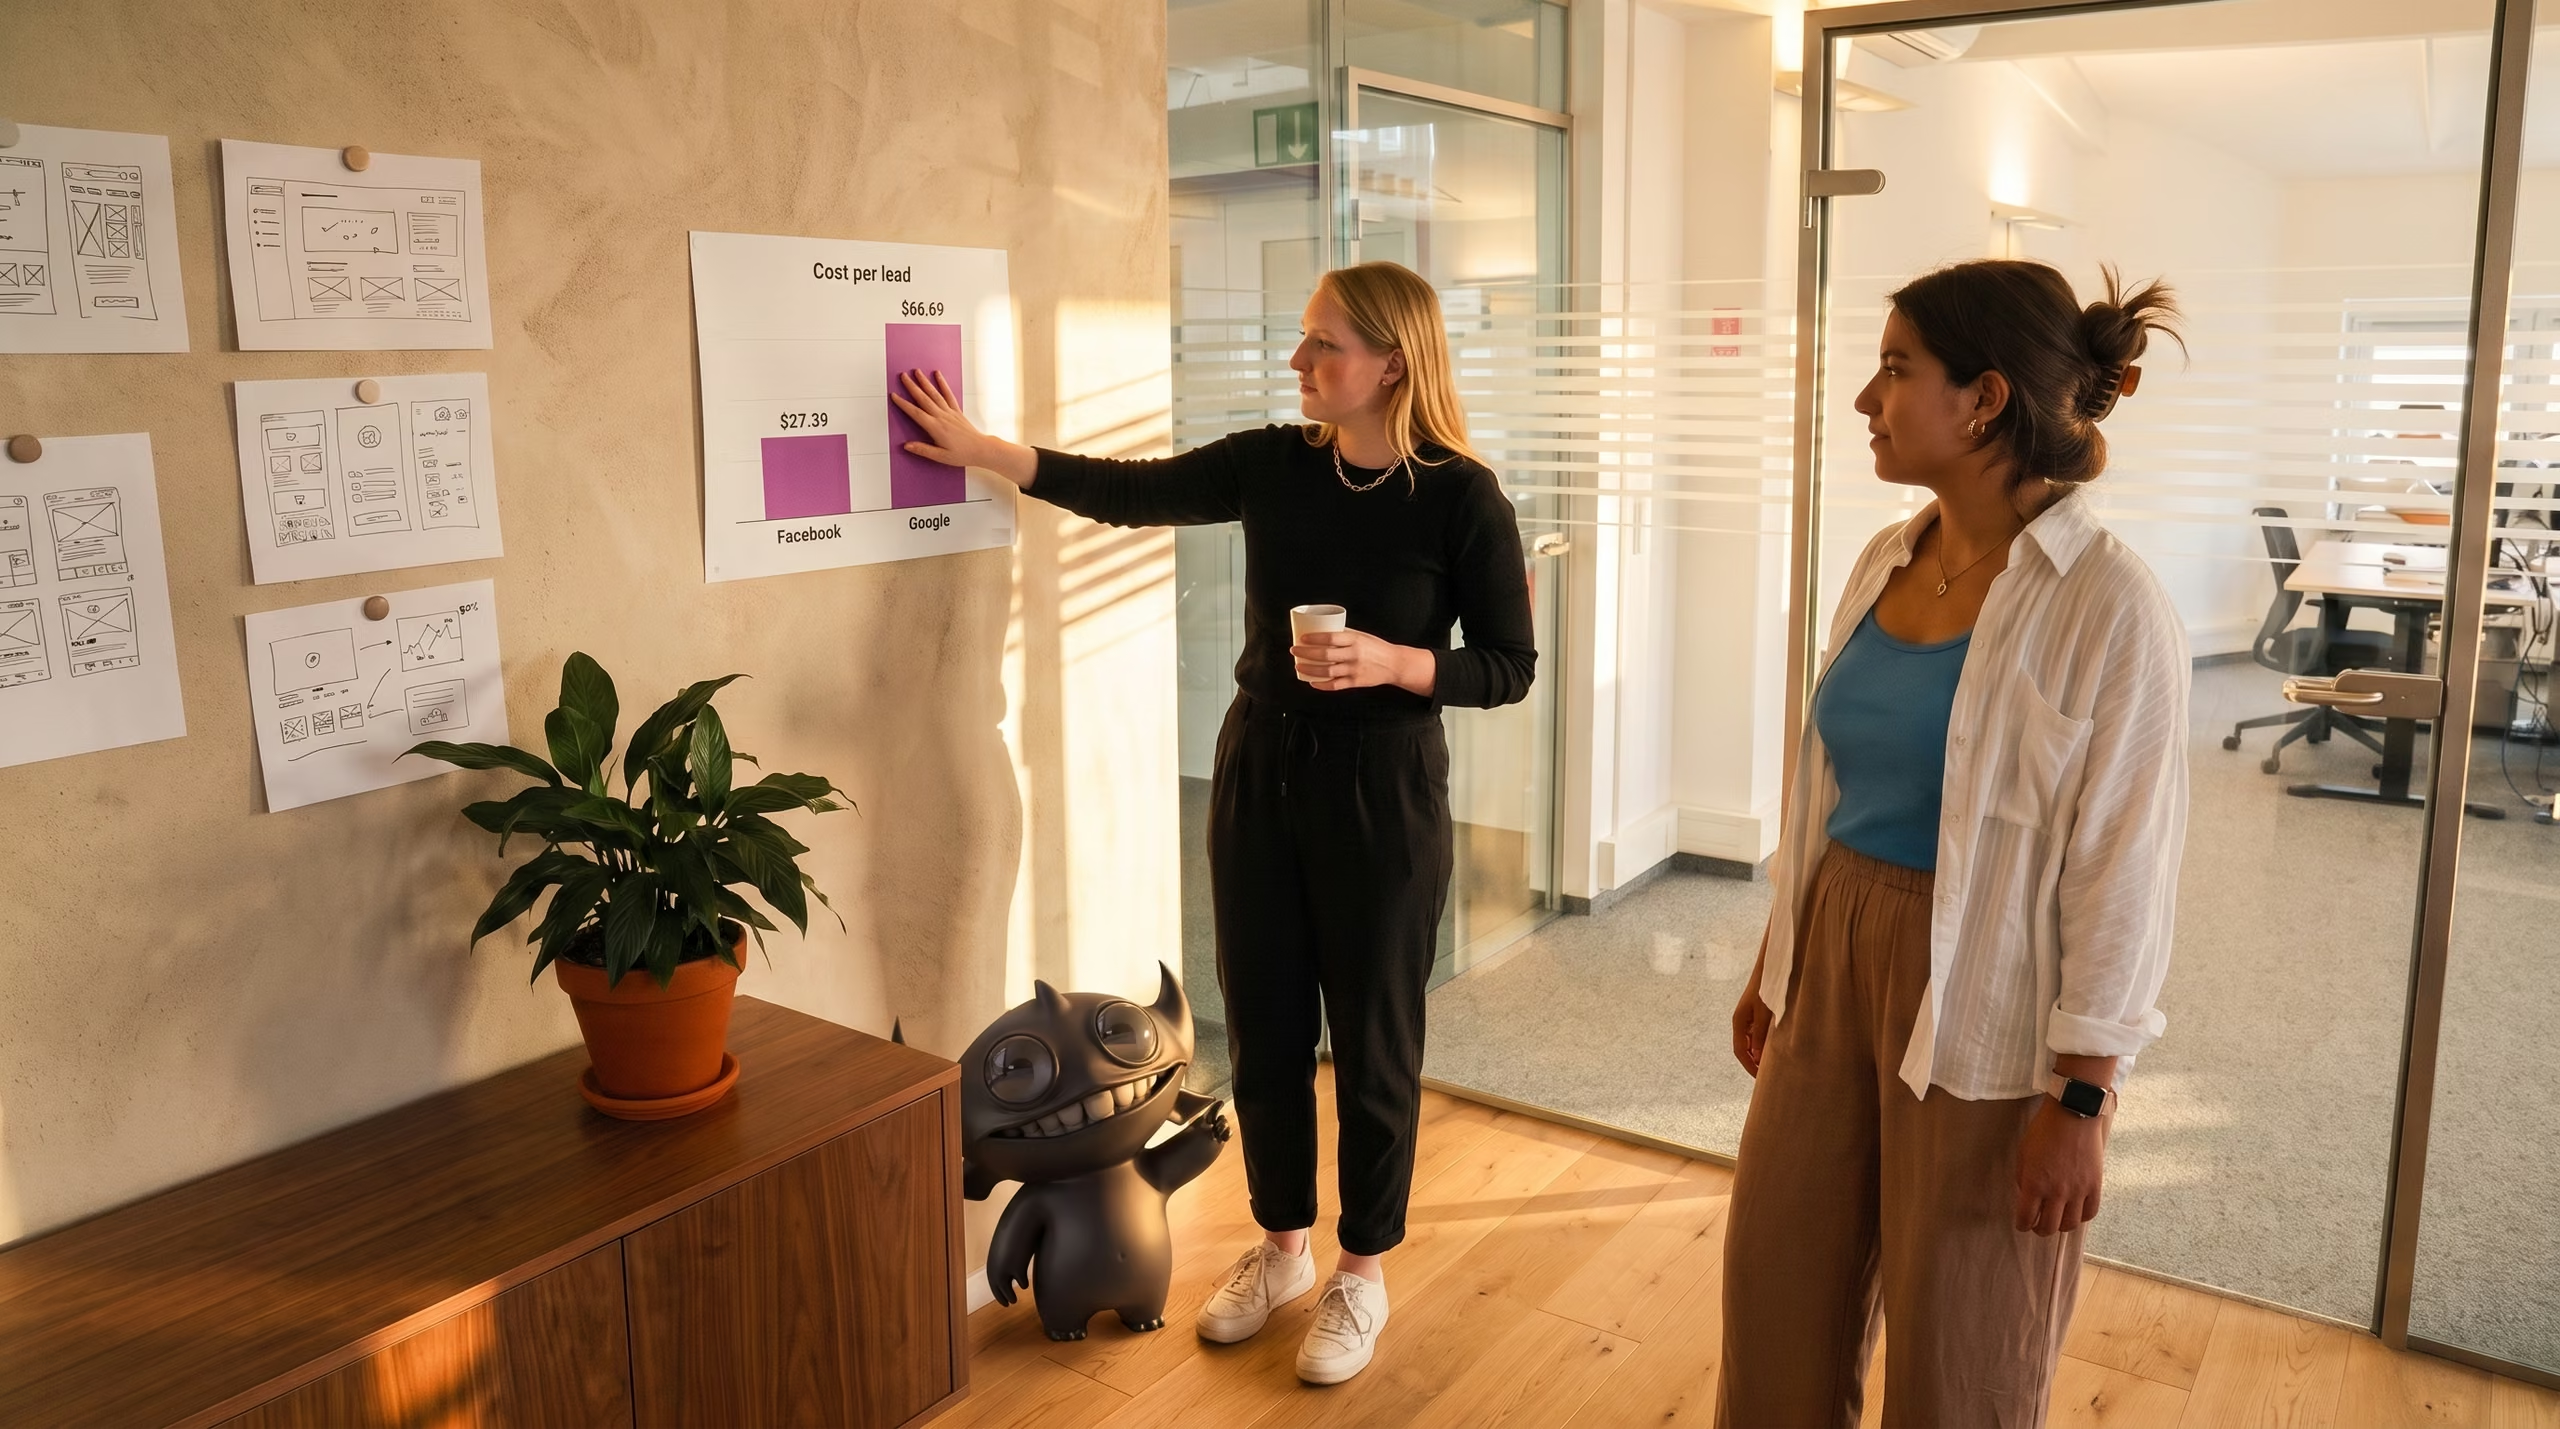
Two colleagues in a warm sand-plaster office corner look at a pinned bar chart reading Cost per lead, a $27.39 Facebook bar beside a $66.69 Google bar, while a small black horned monster stands on the floor at the end of a walnut sideboard, pointing up at the chart and grinning.
Product & UX
14
min read

How Much Do Facebook Ads Cost? $27.39 per Lead

How much do Facebook ads cost? In 2026 the benchmark is $1.80 per click and $27.39 per lead, with cost per lead by industry and a budget table.

A founder points at a Rule of 40 chart on a meeting room wall while two colleagues watch, with Blink standing on the floor at the left.
Product & UX
13
min read

Rule of 40: Only 11% of Private SaaS Firms Meet It

The Rule of 40 is growth rate plus profit margin above 40. Only 11% of private SaaS firms in KeyBanc’s 2024 survey met it. Benchmarks and the math.

Two colleagues at a wooden desk in a brick-walled studio looking at wireframe sketches, with Mumble standing behind them and a printed chart on the wall reading Cost of a bad hire, 39.6 percent.
Product & UX
15
min read

Cost of a Bad Hire: 39.6% of Annual Wage on Average

The average cost of a bad hire is 39.6% of the role’s annual wage, pooled from 31 studies. What that is in dollars for a design hire, traced to source.

Cosy café lounge: a young man tests a simple signup form on a laptop while a UX researcher smiles at him; big green Gloober sits at the round table taking notes, and Blink, the orange ant with a white moustache, stands beside the armchair holding up a Lead conversion chart showing +400% for Better UX over Average UX.
Product & UX
7
min read

UX ROI: Better UX Can Mean 400% Higher Lead Conversion

Does better UX pay off? Forrester and NN/g data on conversion and leads, where UX moves SaaS revenue, and how to measure the lift on your own funnel.

Warm meeting room seen from above: a man raises his hand while presenting to four colleagues around a walnut table; Zap, the pale grey furry monster, has leapt off the table and flies mid-air toward the raised hand, sure it is a high five, while the printed Stock performance chart on the table shows design-led companies at +211% against the S&P 500.
Product & UX
8
min read

DMI Design Value Index: Design-Led Firms Beat the S&P 500 by 211%

The DMI Design Value Index: 16 design-led companies beat the S&P 500 by 211% over 2005-2015. What they do differently, and how a SaaS team can copy it.