


The 10/20/30 rule is Guy Kawasaki’s 2005 guidance that a presentation should run ten slides, last no more than twenty minutes and use no font smaller than thirty points [1], and the measured numbers break it in two places: DocSend puts the average seed deck at 20 slides [2] and measures 3 minutes 44 seconds of VC attention per seed deck, read alone on a screen rather than presented in a room [3].
Kawasaki published the rule on 30 December 2005, while he was a venture capitalist listening to pitches in person [1]. The measured figures come from DocSend’s own platform: a pre-seed and seed study dated 7 July 2021 [2], and a seed-deck report updated on 10 March 2026 [3]. Y Combinator [4] and Sequoia [5] publish what a deck should contain.
This post converts all of it into one unit, seconds per slide, so the rule and the measurements sit on the same line. Every piece of arithmetic is shown and every assumption is named with its value.
What is the 10/20/30 rule?
The 10/20/30 rule is Guy Kawasaki’s rule that, in his words, “a PowerPoint presentation should have ten slides, last no more than twenty minutes, and contain no font smaller than thirty points” [1]. He wrote it as a venture capitalist who'd sat through hundreds of pitches, and he ties the ten slides to ten topics he says a venture capitalist cares about [1]:
- Problem
- Your solution
- Business model
- Underlying magic or technology
- Marketing and sales
- Competition
- Team
- Projections and milestones
- Status and timeline
- Summary and call to action
Kawasaki sets the scope himself. The rule covers “any presentation to reach agreement”, and he names raising capital, making a sale and forming a partnership as the cases he has in mind [1]. All three happen in a room, with your slides behind you.
Why did Kawasaki write the 10/20/30 rule?
Because the pitches he was hearing were long. He describes sixty-slide decks about a patent pending and a first mover advantage, and picks ten as the optimal number because, he argues, a normal human being cannot take in more than ten concepts in a meeting [1].
The twenty minutes has a reason attached too, and it dates the rule precisely. You have an hour slot, he writes, the projector will eat part of it, people arrive late and leave early, so twenty minutes of pitch leaves forty for discussion [1].
That's a rule about a meeting you've already been granted, back when a deck was something you stood next to and talked over. The arithmetic of 10/20/30 lives inside that hour. The hour is the part that changed.
How many slides should a pitch deck have?
Published guidance runs from five slides to twenty, and which end you want depends on which deck you're building: ten in Kawasaki’s rule [1], an average of 18 for pre-seed and 20 for seed in the decks DocSend measured [2], 19 to 20 pages in DocSend’s current recommendation [3], about 5 to 7 on a Y Combinator Demo Day stage [4], and no count at all in Sequoia’s outline [5].
Search this question and most answers land on a 10 to 15 or 12 to 15 slide sweet spot. We tried to trace that range to a dated, named source and could not, so you won't find it repeated here. The numbers above all carry a publisher and a date.
How many slides do seed decks actually have?
DocSend’s 2021 research states it flatly: “you have just 18 slides in a pre-seed deck and 20 in a seed deck to get your story out to an investor” [2].
Read the scope before you use it. Those are averages across decks submitted to DocSend’s own network in 2021, not a count of the decks that went on to raise. So 18 and 20 describe what founders sent, and nothing in the research turns them into a goal.
What do Sequoia and Y Combinator say a deck should contain?
Sequoia’s pitch guide lists ten sections and no length at all: company purpose, problem, solution, why now, market potential, competition and alternatives, business model, team, financials and vision [5]. It went up in March 2019 and was last updated in March 2025.
Y Combinator publishes two different things, and they get merged constantly. Kevin Hale’s Demo Day advice is that “Demo Day slides ideally have only about 5-7 slides”, because you get “2 minutes and 30 seconds” on stage in a room of more than 500 people [4].
Aaron Harris’s seed-deck template is the other one: the deck you send for follow-up conversations, with no numeric cap. Any section there can run more than one slide, though he adds that you probably don't want a set where n is greater than three [6]. Two pages, two artifacts. Quote the 5 to 7 figure at a deck you're emailing and you have quoted the wrong YC page.
How long should a pitch deck be?
Measured in pages, DocSend’s current answer is a 19 to 20 page deck across twelve named sections [3]. Measured in the unit that decides whether your deck gets finished, it is under four minutes: DocSend reports VCs spending an average of three minutes and 44 seconds on a seed deck [3].
Those two framings answer different questions, and the time figures need keeping apart by year and stage. DocSend’s 2021 pre-seed research reports investors “spending just over three minutes on average”, roughly four minutes on decks that went on to succeed, and about a minute and a half on ones that didn't [2].
The 3 minutes 44 seconds figure is seed stage and five years later [3]. Different cohort, different year, different stage. Don't average them, and don't let anyone quote one of them as the other, because the stage and the cohort do the work.
How long do investors actually spend on a pitch deck?
For seed decks, DocSend measures 3 minutes 44 seconds on average, and reports that “only 58% of pitch decks are viewed to completion” [3]. Subtract and you get the number that matters for length: 100 minus 58 is 42, so about two decks in five are never read to the end.
Now look at where the ask sits. It's the twelfth and final section in DocSend’s own order [3], and the last slide in YC’s seed template [6]. Assumption, named: this only bites if your ask is on the last page, which is where both published orders put it.
So length carries a consequence. It decides whether the slide carrying your number gets seen at all.
Does the 10/20/30 rule hold up against pitch deck data?
Partly. Ten slides survives contact with the data, the twenty minutes turns out to describe a different event, and the thirty-point font has nothing measured behind it in any source we read. To see why, convert each published standard into one unit: its own time budget divided by its own slide count.
| What the number measures | Slides or pages | Time | Implied seconds per slide | Source |
|---|---|---|---|---|
| Kawasaki’s rule, spoken pitch meeting | 10 slides | 20 minutes | 120 | [1] |
| YC Demo Day, live stage slot | 5 to 7 slides | 2 min 30 s | about 25 | [4] |
| DocSend recommendation, seed deck read alone | 19 to 20 pages | 3 min 44 s measured | about 11.5 | [3] |
| DocSend measured average, seed deck read alone | 20 slides | 3 min 44 s | 11.2 | [2][3] |
| DocSend measured average, pre-seed deck read alone | 18 slides | just over 3 minutes | about 10 to 11 | [2] |
| Sequoia outline | 10 sections, no count given | not stated | not stated | [5] |
Every row above, with the arithmetic and the assumption behind it:
- Kawasaki, 120 seconds. Twenty minutes is 1,200 seconds, divided by ten slides. Assumption A-EVEN: the twenty minutes spread evenly. He sets a ceiling on both numbers and never writes a per-slide budget.
- DocSend recommendation, 11.5 seconds. 3 minutes 44 seconds is 224 seconds, and 19.5 pages is the midpoint of DocSend’s own 19 to 20 range. 224 divided by 19.5 is 11.49. Assumptions A-MID (the midpoint) and A-SPREAD (attention spread evenly, which DocSend’s own section figures contradict).
- Measured seed deck, 11.2 seconds. 224 divided by 20 slides. Assumption A-COHORT: the 20-slide count is DocSend’s 2021 figure and the 224 seconds is its 2026 seed figure. Two cohorts, five years apart, in one row deliberately, and the row to argue with first.
- Demo Day, about 25 seconds. 2 minutes 30 seconds is 150 seconds, divided by 6 slides, the midpoint of 5 to 7. At five slides it is 30 seconds, at seven 21.4. Assumption A-STAGE: a live slot in front of a large room, which is a third artifact again.
- Pre-seed, about 10 to 11 seconds. “Just over three minutes” over 18 slides: 180 divided by 18 is 10.0, and 195 divided by 18 is 10.8. Assumption A-FLOOR: 180 seconds is the floor of “just over three minutes” and 195 a generous reading of it, so the row gives a range and not a point.
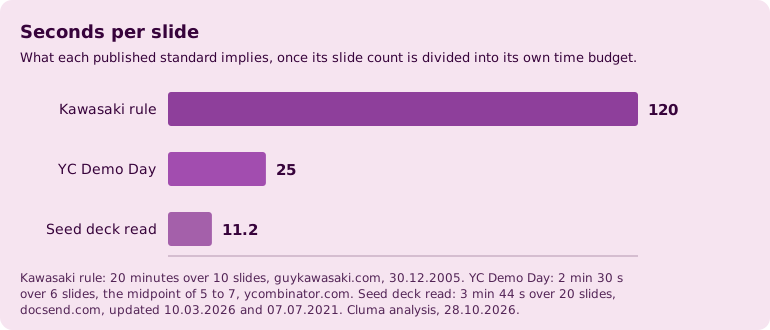
Two findings come out of that table, and they pull in opposite directions.
Finding one: the rule assumes roughly ten times as long per slide as a seed deck actually gets. 120 divided by 11.2 is 10.7. That ratio passes no verdict on founders or on Kawasaki. It's a change of artifact: he priced a meeting that had already been granted, and DocSend measures the screening that happens before any meeting exists.
Finding two: inside the measured attention budget, ten slides is a defensible number. 224 seconds over ten slides is 22.4 seconds each, double the 11.2 that a twenty-slide deck gets.
Assumption A-FIXED: we treat the 224 seconds as fixed and independent of deck length. DocSend publishes no split of time by deck length, so that is our assumption, and it can fail in both directions. A shorter deck might simply get closed sooner.
So the ten in 10/20/30 is the part worth keeping, for a reason Kawasaki never gave. More sourced analysis sits on the reports page, and the adjacent dataset on what design is worth to SaaS companies is in the SaaS design investment statistics.
Where this breaks
- An average is not a target. DocSend’s 18 and 20 describe the decks founders submitted in 2021, with no filter for the ones that raised [2].
- A per-slide average hides where attention lands. DocSend publishes a figure per deck section, and its longest look is 64 seconds on the business model section [3]. An even split is a planning budget and nothing more.
- DocSend’s section figures don't add up to its own average, and we checked. Those twelve per-section times sum to 450 seconds, or 7 minutes 30 seconds, about twice the 224 seconds the same page gives as the average [3]. The twelve average section lengths sum to 21.95 pages, above the 19 to 20 page deck that page recommends. Both sets are averages over different decks. Neither is wrong, and neither can be built from the other.
- The 11.2 row blends two cohorts. On 2021 figures alone it is 10 to 11 seconds, and on the 2026 recommendation alone, 11.5. The finding holds in all three versions, which is why we left the blended row in and labelled it.
- Reading and speaking are different jobs. Neither 11.2 nor 11.5 seconds is an instruction for how fast to talk. If you're standing up in front of the deck, Kawasaki’s pace is the relevant one.
- The success split is an association. 240 seconds over 18 slides is 13.3 a slide for decks that went on to succeed, against 90 over 18, or 5.0, for ones that didn't, a 2.7x difference in time spent [2]. One 2021 pre-seed cohort. It doesn't say that holding attention causes a raise.
The pitch deck numbers we could not trace
Three widely quoted pitch deck figures are missing from this post on purpose, and they're worth naming, because you'll meet all three while researching this question.
The 2 minutes 42 seconds figure. It is quoted everywhere as DocSend’s average time on a deck. The DocSend URL that secondary sites cite for it no longer loads, and the one live page carrying the number is a gated form rather than a readable article. We could not read and quote a primary page, so the figure is cut.
A DocSend and Harvard study of 200 decks that raised $360 million. We found it only secondhand, through aggregator posts, with no DocSend or Harvard page describing that collaboration. Cut on the same rule.
The 10 to 15 slide sweet spot. It is stated as settled fact across the fundraising blogs that rank for this question, with nothing dated underneath it. We'd rather be three numbers short than publish one that has no origin.
Is a thirty-point font right for a pitch deck?
Nothing in this research set measures type size in real pitch decks, so the thirty points rest on Kawasaki’s argument alone, and his argument is about a room. He says presenters use ten-point type because they don't know their material or because they think more text is more convincing, and that an audience reads ahead of anyone reading slides aloud [1].
He also offers a way out of the exact number: “find out the age of the oldest person in your audience and divide it by two. That’s your optimal font size” [1]. That's a legibility rule for a projected slide, and it reads as one.
YC makes the same point about the room and skips the type size. Hale tells founders the Demo Day room holds over 500 people who can't all sit in the front row, so the slides have to be legible from the back [4].
On a laptop at arm’s length, the back row does not exist. Thirty points may be solving a problem your reader doesn't have, and we publish no replacement number, because nothing in these sources measures one.
What font size should a pitch deck use?
By Kawasaki’s own algorithm, an audience whose oldest member is 60 gives you 30 points, and an oldest member of 50 gives you 25 [1]. That's his arithmetic applied to two ages, and it assumes a projector.
What the sourced numbers speak to is the amount of text on a slide. At 11.2 seconds a slide, a slide your reader can't take in at a glance is a slide that gets skipped.
The three decks founders keep confusing
The stage pitch. About 5 to 7 slides spoken in a slot of 2 minutes 30 seconds, in a room holding more than 500 people [4]. Fast, legible from the back, roughly 25 seconds a slide. Nobody reads this one alone.
The sent deck. 19 to 20 pages, opened alone on a screen, 3 minutes 44 seconds of attention, 58% finished [3]. No one's there to explain it, which puts it at about 11.2 seconds a slide and makes the order of your sections do the talking.
The meeting deck. Kawasaki’s ten slides in twenty minutes, with forty minutes left for discussion [1]. 120 seconds a slide, spoken, in a meeting you already have. YC’s seed template is the same artifact with no numeric cap on it [6].
One story can serve all three, and one file can't. None of those three per-slide numbers transfers to the others, so most arguments about how many slides a pitch deck should have are two people pricing different artifacts.
What this means for your next deck
The decision in front of you is how many versions of this deck you're going to need before the round closes.
The numbers above already say the deck gets re-cut. Two in five are not read to the end [3], and decks that went on to succeed held 2.7 times the attention of ones that didn't [2]. Both are fixed by re-ordering, trimming and re-charting, work that happens after investor calls rather than before the first one.
Cluma’s uFund module covers that work at a flat $3,495 a month. The live page carries the terms: one request in progress with unlimited requests queued, unlimited revisions while you subscribe, and the first month paid in full before you pause or cancel [7].
| Option | What you pay | Per page at 19 to 20 pages | What it covers |
|---|---|---|---|
| Cluma, uFund module | $3,495 a month, flat [7] | about $179 | the deck plus the demo video, one-pager, infographics, graphs and reports, unlimited revisions while subscribed, one request in progress at a time |
| A one-off deck, freelancer or agency | quoted per deck or per slide | no figure published here | one deck, with revisions usually capped by the quote |
| Your own time, in a template | your time | not a cash cost | one deck, as good as the slide skills already on your team |
The arithmetic on the first row: $3,495 divided by 19.5 pages is $179.23 a page, and the same month divided by a ten-slide deck is $349.50 a slide. Assumption A-ONEDECK: one 19.5-page deck inside one month on one module, nothing else in the queue. That per-page figure drops with everything else the month carries.
Those two numbers together are the actual point. Cost per slide is the wrong unit, because the ten-slide deck costs more per slide and is often the better deck.
The middle row stays empty for a reason. No primary or named source in this research gives a market rate for a one-off deck, and we don’t treat a vendor’s own blog as a price source, so that cell stays blank.
When the other options are the better buy. If you need one deck, once, from a template you already own, and nobody will touch it again after the raise, build it yourself. Nothing here argues otherwise.
If deck work, product marketing and sales material run all year, the in-house seat earns its keep, and that arithmetic is worked through in how much a graphic designer costs. The monthly options are laid out in the best design subscriptions for SaaS.
A flat month earns its place in the case in between: a raise that runs for weeks, behind a deck that keeps moving.
If you want the slides built around those numbers instead of a template, Cluma’s pitch deck design service covers the deck, the one-pager, the charts and the demo video for a flat $3,495 a month, with progress roughly every 48 hours [7].
References
- Guy Kawasaki, The 10/20/30 Rule of PowerPoint, published 30.12.2005 per the page’s own schema, template stamp 24.10.2016, text unchanged. Read 28.10.2026. Source of the three numbers, the ten topics, the font algorithm and the twenty-minute reasoning. Limitations: one practitioner’s guidance, twenty years old, written for a projected pitch meeting, and it measures nothing.
- DocSend, 4 Mistakes to Avoid in Your Startup Fundraising Pitch Deck, dated 07.07.2021. Read 28.10.2026. Source of the 18-slide pre-seed and 20-slide seed averages and the 2021 time figures. Limitations: no published sample size, a 2021 cohort, averages across decks submitted rather than decks that raised, and a vendor with an interest in decks being sent as tracked links.
- DocSend, What VCs Really Want to See Inside Your Seed Deck, originally 03.05.2022, updated 10.03.2026, author Justin Izzo. Read 28.10.2026. Source of the 3 minutes 44 seconds average, the 58% completion rate, the 19 to 20 page recommendation, the twelve sections with the ask last, and the per-section figures summed above. Limitations: no published sample size, a different cohort and year from reference 2, and the internal gap this post states rather than smooths, since the twelve per-section times add to 450 seconds against the 224-second average printed on the same page.
- Y Combinator, Kevin Hale, How to Design a Better Pitch Deck. Read 28.10.2026. Source of the 5 to 7 Demo Day slides, the 2 minute 30 second slot and the 500-person room. Limitations: no dateline on the live page, and it covers the Demo Day stage deck only.
- Sequoia Capital, Writing a Business Plan, Team Sequoia, published 15.03.2019, modified 13.03.2025 per the page schema. Read 28.10.2026. Source of the ten-section outline. Limitation: no length or timing guidance at all, which is why it enters the table as a blank.
- Y Combinator, Aaron Harris, How to Build Your Seed Round Pitch Deck. Read 28.10.2026. Source of the seed-deck template, the ask as the closing slide, and the limit of three slides on one topic. Limitation: no dateline, though its own text places it a week before the Winter 2018 Demo Day.
- Cluma, pitch deck design service page (cluma.design/pitch-deck-design-service), price and module terms read from the live page on 28.10.2026. A first-party source, so it carries the weakness of any vendor quoting itself. No third party checked it. Source of the $3,495 a month uFund figure, the deliverables listed in the comparison table, the one-request-in-progress term and the progress-every-48-hours line.
We cut three figures rather than soften them. The 2 minutes 42 seconds DocSend average is out because the URL secondary sites cite for it no longer loads and the only live page carrying it is a gated form.
The DocSend and Harvard study of 200 decks raising $360 million is out because it turned up only through aggregators. The 10 to 15 slide sweet spot is out because no dated, named source for it exists anywhere we could reach, in the SERP for the question or behind it. Search volumes used in our planning stay out of the article.