



A full-time in-house graphic designer costs a US employer about $89,951 a year, or $7,496 a month, once employer benefits are added to the national median wage of $62,960 [1][2]. That's the cost to you, which is a bigger number than the salary line in the offer letter.
Both halves of the number are US Bureau of Labor Statistics series. BLS puts the median annual wage for graphic designers at $62,960 [1]. It also measures what employers pay beyond wages: across private industry, benefits were 30.0 percent of total compensation per hour worked in June 2026 [2].
Below you get six wage points from BLS, the multiplier that turns each one into a cost to the employer, and the result, so you can redo every line by hand. Where a cost couldn't be sourced today, it's named and left out rather than estimated.
Two things are worth knowing before the table. This figure is a floor, because recruiting, software, equipment and ramp-up aren't in it, and it prices one salaried designer rather than a project.
How much does a graphic designer cost an employer?
An in-house graphic designer costs a US employer between $56,462 and $149,885 a year, and $89,951 at the median, depending on where the hire sits in the national wage distribution [1][2]. Monthly, that's $4,705 to $12,490, and $7,496 in the middle.
Wages themselves are lower at every point. BLS reports $39,520 a year at the 10th percentile, $62,960 at the median and $104,910 at the 90th [1]. What sits between the wage and the cost is everything an employer pays on top of the paycheck, and BLS measures that directly.
Across private industry, total compensation averaged $46.89 an hour worked in June 2026. Wages and salaries were $32.82 of it, or 70.0 percent, and benefits were $14.07, or 30.0 percent [2]. Divide total compensation by wages and you get a load multiplier of 1.4287, which is the single rule behind every loaded figure in this post.
No single BLS table prints this figure. It comes from putting the two series together, which is the whole of the method here.
Here's the median worked through, start to finish.
BLS reports a median annual wage of $62,960 for graphic designers [1], and the ECEC ratio of 46.89 to 32.82 gives a multiplier of 1.4287 [2]. So 62,960 x 1.4287 = $89,951 a year, of which 89,951 - 62,960 = $26,991 is the employer’s benefit cost. Divided by twelve, that's $7,496 a month.
One scope note belongs right here, because it's the least precise part of the model. BLS publishes that 70/30 split for all private-industry occupations together, rather than for graphic designers [2]. No ECEC breakdown exists at the level of a single occupation code, so the multiplier is economy-wide while the wage it multiplies is design-specific.
All six wage points BLS publishes for the occupation, loaded and converted:
| Wage point | Hourly wage | Annual wage | Fully loaded, a year | Fully loaded, a month | Fully loaded, an hour |
|---|---|---|---|---|---|
| 10th percentile | $19.00 | $39,520 | $56,462 | $4,705 | $27.15 |
| 25th percentile | $23.58 | $49,040 | $70,063 | $5,839 | $33.68 |
| Median | $30.27 | $62,960 | $89,951 | $7,496 | $43.25 |
| Mean | $33.92 | $70,560 | $100,809 | $8,401 | $48.47 |
| 75th percentile | $39.34 | $81,830 | $116,911 | $9,743 | $56.21 |
| 90th percentile | $50.44 | $104,910 | $149,885 | $12,490 | $72.06 |
Wages are BLS OEWS, May 2025, national, all industries, SOC 27-1024 [1]. Each loaded column is that wage times 1.4287, the ECEC ratio [2], then divided by twelve months or by 2,080 paid hours.
Monthly is how most budgets read this. A median in-house graphic designer costs $7,496 a month fully loaded, against $5,247 for the wage on its own, which is 62,960 divided by twelve. That $2,249 gap is the employer’s benefit cost, 26,991 divided by twelve, and no job ad mentions it.
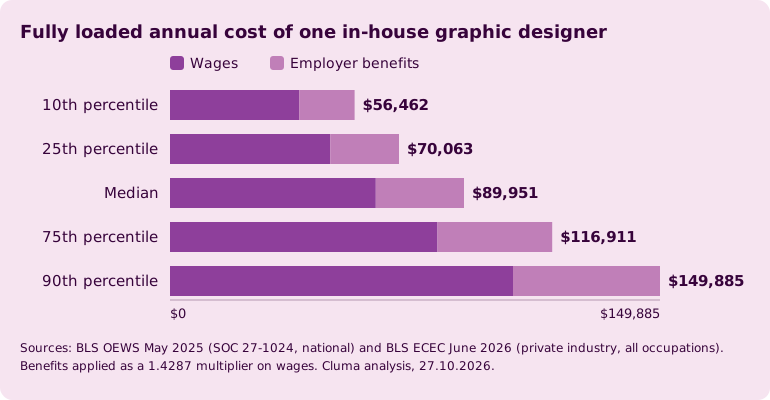
Mean and median are not the same question, and the gap between them matters here. Median means the middle wage, so half of US graphic designers earn less and half earn more. Mean is the average, which a smaller number of high earners pulls upward, and at $70,560 it sits $7,600 above the median of $62,960 [1]. Budget off the median when you are hiring one person in the middle of the market, and off the mean when you are modelling a whole team.
What does a graphic designer cost per hour?
A graphic designer costs a US employer $43.25 an hour at the median and $48.47 at the mean, against the $33.92 mean hourly wage [1][2]. At the 90th percentile the loaded hourly cost reaches $72.06.
Assumption, stated as one: 2,080 paid hours a year, which is 40 hours a week for 52 weeks. It's BLS’s own convention, and it needs no faith, because BLS publishes hourly and annual wages for the same series and the two agree.
Check it at the extremes. A median hourly wage of $30.27 times 2,080 hours comes to $62,962 against a published median annual wage of $62,960, and the 90th percentile of $50.44 times 2,080 comes to $104,915 against a published $104,910 [1]. All six pairs in the table above agree to within 0.02 percent.
That matters if you're comparing an in-house hire with an hourly quote from outside the company. At the median, set $43.25 beside the quote. The wage is what lands in the designer’s account, and the loaded figure is what leaves your budget.
One caveat rides on every hourly number here. ECEC measures cost per hour worked, and 2,080 counts hours paid, holidays and paid leave included. So an hour of actual design work costs more than $43.25, by however much leave your own policy grants.
How much should I pay a graphic designer?
Pay a US graphic designer between $19.00 and $50.44 an hour, or $39,520 and $104,910 a year, and expect the middle of the market at $30.27 an hour or $62,960 a year [1]. The outer figures there are the 10th and 90th percentiles of what US employers actually paid in May 2025, and the middle pair is the median.
One warning about reading percentiles as levels. BLS counted 197,830 graphic designers in US employment that month [1], and the 90th percentile is where the top tenth of them sit, which in practice mixes senior people, specialists, expensive metros and well-paying industries.
Treat the band as the market you're bidding into, and let your own scope, location and seniority decide where in it you land.
If the quote is coming from outside the company, compare it with the loaded column instead. At the median that's $43.25 an hour, $7,496 a month or $89,951 a year, because that's what the equivalent hire takes out of your budget.
There's a one-line version you can run on any offer you're drafting: multiply the wage by 1.4287, and you have roughly what the hire costs you [2].
What this number leaves out
One framing first, because this search often means the hiring event instead of the running cost. Everything above is the running cost: what one designer costs you in every year they stay. That hiring event, the advertising, the screening hours and the weeks a role sits open, is a separate bill, and this post carries no figure for it.
Four real costs sit outside every figure above: recruiting, software, equipment, and the ramp-up time before a new hire is productive. We left all four out rather than estimate them, and the reason is worth saying plainly.
We couldn't read a primary source for any of them today. Adobe’s pricing pages could not be read reliably, so no Creative Cloud list price is verified here.
SHRM’s cost-per-hire and time-to-fill benchmarks sit behind a member login, and the benchmarking page we reached carried membership chrome instead of the figures.
Cost-per-hire benchmarks attributed to SHRM circulate widely, and we could not open a single SHRM page that carries them, so this post quotes no recruiting figure at all. A number whose origin you can't reach isn't a number to budget with.
So $89,951 is a floor. Add your own recruiting cost, software bill and ramp-up, and the real figure moves up from there.
Where this model breaks
Six limits, and the first two move the number most.
The benefits multiplier is economy-wide. BLS publishes no ECEC split for a single occupation code, so 1.4287 is the average across all private-industry jobs [2]. A design-specific load could run higher or lower, and nothing in the published data says which.
Hours worked are not hours paid. The 1.4287 ratio comes from costs per hour worked, while the hourly columns divide by 2,080 hours paid. Every hourly figure here is therefore a little low as the price of an hour of real design work.
These are national estimates. BLS publishes the same occupation by state and by metro area, and this post uses only the national series, so a hire in an expensive metro costs more than the table says.
The occupation code is narrower than the job title. BLS defines 27-1024 as design to meet specific commercial or promotional needs such as packaging, displays or logos, and it explicitly excludes Web and Digital Interface Designers, code 15-1255 [1]. A hire who also owns product UI is priced elsewhere.
Recruiting, software, equipment and ramp-up are missing. That's the gap above, and it's why $89,951 is a floor.
A wage is not a productivity measure. The table prices an hour of someone’s time. It says nothing about how many assets come out of that hour, so a cheaper designer isn't automatically cheaper per asset.
In-house, freelance, agency or a design subscription?
Four ways to buy graphic design, with the only two monthly figures this post can source:
| Option | What you pay for | Monthly cost | Commitment | How much runs at once |
|---|---|---|---|---|
| In-house hire | A salary plus the benefits BLS measures | $4,705 to $12,490, and $7,496 at the median [1][2] | An employment contract | One designer, about 40 hours a week |
| Freelancer | Hours or a fixed fee, invoiced per engagement | No primary-source rate verified for this post | Per project or per hour | What you have briefed and funded |
| Agency retainer | A monthly fee for an agreed scope | No primary-source rate verified for this post | Usually a contract term | The scope written into the retainer |
| Design subscription (Cluma) | A flat monthly rate per discipline module | $3,495 uCreate, $3,995 uRun, $7,490 for both [3] | First month in full, then pause or cancel, no cancellation fee [3] | One request in progress per module, unlimited queued [3] |
The freelance and agency cells are blank on purpose. Marketplace pages that publish those rates could not be accessed when this post was written, and the rates we hold on file are for web and UI designers, a different occupation code. Freelance pricing gets its own post rather than a borrowed number here, and project work, which none of these four rows price, is handled in our web design cost calculator.
The two sourced figures land almost on top of each other. Cluma’s two graphic design modules, uCreate and uRun, cost $7,490 a month together [3], against $7,496 for the fully loaded median in-house designer. That's $71 across a year, at $89,880 against $89,951, which comes to $5.92 a month.
So price is the wrong question here. What roughly $7,490 buys is the right one. One in-house designer is about 40 hours a week of dedicated capacity, plus someone carrying your product context in their head, and recruiting, ramp-up and an employment contract come with it.
Two modules are two disciplines in parallel, one request in progress each with unlimited requests queued behind them, senior-owned and senior-reviewed, with no recruiting and no ramp-up [3].
Everyday tasks like a post, an ad or a banner land in about 48 hours, and bigger campaign sets move in milestones with progress roughly every 48 hours [3]. Billing stops immediately when you pause [3].
The hire wins when the work is steady. If you have 40 hours of design a week, every week, for years, and you want that person in your standups arguing about the roadmap, hire. A subscription is capacity you switch on and off, and a salaried colleague is the right instrument for volume that never drops.
Below that volume, one module is the smaller commitment. uCreate at $3,495 a month or uRun at $3,995 sits $4,001 and $3,501 below the loaded median hire [1][2][3], and every module’s price is on the Cluma pricing page.
For what SaaS teams spend on design overall, the sourced picture is in our SaaS design investment statistics, and the rest of our data work sits on the Cluma reports page.
Set your weekly design load beside the table above, and the graphic design subscription page carries the module scope and prices for the other side of that comparison.
References
- US Bureau of Labor Statistics, Occupational Employment and Wage Statistics, national cross-industry estimates for SOC 27-1024 Graphic Designers, reference period May 2025, read from the LABSTAT public data file oe.data.0.Current (file dated 15.05.2026), with oe.occupation for the occupation definition and oe.datatype for the series codes. Read 27.10.2026. Source of every wage figure in this post, of the employment count of 197,830, and of the exclusion of Web and Digital Interface Designers from the occupation. Limitations: the per-occupation OEWS web page now redirects to the OEWS tables index, so these series were read from the flat file instead of an HTML profile. OEWS surveys establishments and measures employee wages, so it prices employment and says nothing about freelance billing. Estimates here are national, with state and metro series published separately and unused.
- US Bureau of Labor Statistics, Employer Costs for Employee Compensation, June 2026, with the underlying quarterly series for total compensation, wages and salaries and total benefits, private industry workers. Read 27.10.2026. The release states that total employer compensation costs for private industry workers averaged $46.89 per hour worked in June 2026, that wages and salaries averaged $32.82 and accounted for 70.0 percent of employer costs, and that benefit costs averaged $14.07 and accounted for the remaining 30.0 percent. This is the source of the 1.4287 multiplier. Main limitation: ECEC is published for all private-industry occupations together, so the 30 percent benefits share is economy-wide and is applied in this post to a design-specific wage. ECEC also measures cost per hour worked, while the hourly columns divide by hours paid.
- Cluma, graphic design subscription and pricing, both read 27.10.2026. Source of the module prices of $3,495 for uCreate, $3,995 for uRun and $7,490 for both, of one request in progress per module with unlimited requests queued, unlimited revisions while subscribed, the first month paid in full and then pause or cancel with no cancellation fee, the 7-day trial, and the turnaround of about 48 hours on everyday tasks with bigger campaign sets moving in milestones. Disclosure: Cluma publishes this post and is one of the four options in the table above, on the same basis as the other three.