



Yes, the evidence points that way: in McKinsey’s five-year study of 300 publicly listed companies, the top quartile of design performers grew revenue 32 percentage points faster and total returns to shareholders 56 percentage points faster than their industry peers [1]. McKinsey sums it up as growing revenues and shareholder returns at “nearly twice the rate” of industry counterparts [1].
For a SaaS founder, marketing lead or product lead, that's the question behind every design budget: will it pay back? This article walks through what McKinsey found, the four habits that set the top performers apart and what they mean for a SaaS team. It ends with how to build those habits without hiring a whole design department. More sourced data sits on the Cluma reports page.
What did McKinsey find about the value of design?
McKinsey describes its study as, at the time of writing, the most extensive and rigorous research of its kind [1]. Its researchers tracked the design practices of 300 publicly listed companies over five years, interviewed or surveyed their senior business and design leaders, collected more than two million pieces of financial data and recorded more than 100,000 design actions [1]. A regression analysis then picked out the 12 design actions most closely linked to better financial performance. Those actions fall into four themes, which form the McKinsey Design Index, or MDI, a rating of how strong a company is at design [1].
| Finding | Figure | Source |
|---|---|---|
| Revenue growth, top-quartile design performers vs industry peers, five years | 32 percentage points faster | Article [1], Exhibit 3 [2] |
| Growth in total returns to shareholders (TRS), same comparison | 56 percentage points faster | Article [1], Exhibit 3 [2] |
| Annual revenue growth, top quartile vs industry benchmarks | 10% vs 3 to 6% | Exhibit 1 [2] |
| Annual TRS growth, top quartile vs industry benchmarks | 21% vs 12 to 16% | Exhibit 1 [2] |
| Companies tracked | 300 publicly listed companies, five years | Article [1] |
| Data behind it | More than 2 million pieces of financial data, more than 100,000 design actions | Article [1] |
| Industries | Medical technology, consumer goods, retail banking | Article [1] |
What does 32 percentage points of extra growth look like?
It's the lead in growth over the whole five years, measured against industry peers [1]. McKinsey’s own annual rates show how big that is. Exhibit 1 of the report puts the top quartile’s revenue growth at 10% a year, against 3 to 6% for industry benchmarks [2]. Run that over five years:
- 10% a year compounds to 61% (1.10 to the fifth power is 1.61).
- 3 to 6% a year compounds to 16 to 34% (1.03 to the fifth is 1.16, 1.06 to the fifth is 1.34).
- The lead lands between 27 and 45 percentage points, right around McKinsey’s 32.
We did that arithmetic ourselves. It also shows why McKinsey talks about nearly twice the rate: 61% growth is 32 points ahead of peers growing 29% (61 minus 32), roughly double their growth.
What is design worth to a business?
What is the business value of design according to McKinsey & Company?
McKinsey found a strong correlation between high design scores and superior business performance [1].
Most of the payoff sat at the top.
Differences between the second, third and fourth quartiles were marginal, and in McKinsey’s words the market “disproportionately rewarded companies that truly stood out from the crowd” [1].
That's the useful part for a budget decision. Reaching the top quartile took excellence across all four themes of the index, and McKinsey found that combination relatively rare [1]. Company scores ranged from 43 to 92 [1], so there's a lot of room between an average design practice and a great one.
In McKinsey’s data, the lead went to companies that did all four things well, which suggests design works as an ongoing practice more than a one-off project.
Did top design performers lead in every industry?
They did in all three industries McKinsey studied: medical technology, consumer goods and retail banking [1]. McKinsey reads that as a sign that good design matters whether a company sells physical goods, digital products, services or a mix [1].
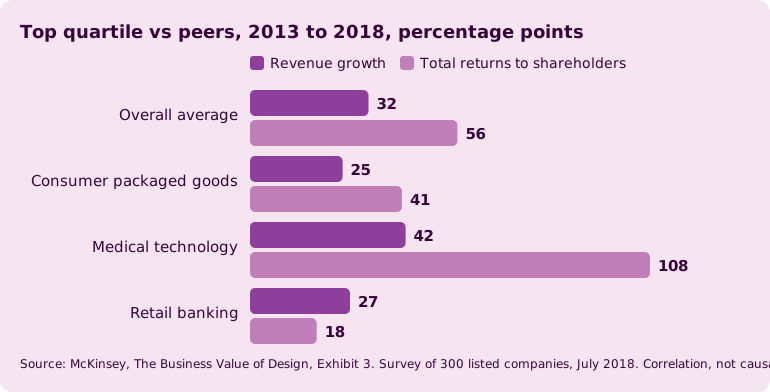
The size of the lead varied by sector. In medical technology, the top quartile’s lead in shareholder returns reached 108 percentage points, almost twice the 56-point average [2]. Consumer packaged goods came in at 25 points of revenue and 41 of TRS, while in retail banking the revenue lead of 27 points was the stronger of the two [2].
The four habits of top-quartile design performers
The four themes read like a playbook. Each one below pairs what McKinsey saw with how it translates to a SaaS team, from the metrics you report to the way you ship. More practical guides sit on our tutorials page.
Analytical leadership: measure design like revenue
The best financial performers treated design as a top-management issue and tracked design performance with the same rigor as revenues and costs [1]. Just over half of the companies surveyed admitted they had no objective way to assess or set targets for their design teams’ output [1].
SaaS takeaway: tie design work to numbers you already report.
- Pick the metric each piece of work should move: trial-to-paid conversion, activation, onboarding completion, demo requests or support tickets about the interface.
- Review design in the same meeting as pipeline.
User experience: design the whole journey
Top-quartile companies broke down the walls between physical, digital and service design [1]. They start from the customer journey and its pain points, backed by research gathered firsthand, and they champion those insights in every meeting. Yet only around 50 percent of the companies surveyed ran user research before generating their first design ideas [1].
SaaS takeaway: buyers don't see departments. The ad, the website, the signup, the product, the onboarding emails and the sales deck are one experience.
- Map your journey from first click to first value.
- Talk to a few users before you brief a feature.
- Fix the moments where the story breaks.
Cross-functional talent: make design everyone’s job
The top performers made user-centric design everyone’s responsibility instead of a siloed function [1]. One of the strongest correlations in the research linked top financial performance to breaking down functional silos and integrating designers with other functions [1]. Top-quartile companies were also almost three times more likely to run incentive programs for designers tied to design outcomes [1].
SaaS takeaway: keep design inside the loop. Designers should see the roadmap, the campaign calendar and customer feedback, and product, marketing and engineering should see design work while it's still in progress. A shared board where requests, updates and revisions live does more for this than any org chart.
Continuous iteration: test early, keep improving
Design flourishes where teams keep learning, testing and iterating with users, which McKinsey says raises the odds of breakthrough products while reducing the risk of costly misses [1]. Almost 60 percent of the companies surveyed used prototypes only for internal testing, late in development [1]. Top performers shared early prototypes with outsiders and kept iterating after launch [1].
SaaS takeaway: software already ships in releases, so let design follow the same rhythm.
- Put a clickable prototype in front of customers before you build.
- Release in small steps, and treat every landing page and onboarding flow as a draft you'll improve with data.


