



Facebook ads cost $1.80 per click and $27.39 per lead on the leads objective in 2026, and $0.60 per click on the traffic objective, measured across almost 1,800 campaigns in 20 industries [1][2]. Those are averages. An average is not a quote for your account.
The publisher is LocaliQ, a PPC management company reporting performance from its own advertiser base. We say that up front because it matters: no government series and no research firm publishes Facebook ad prices, so the best available numbers come from companies that sell ad management.
What follows is the benchmark split by objective, the same numbers broken out by industry, and a table that turns a monthly budget into clicks and leads at those rates. Every division in it is one you can redo on a phone.
You'll also find three places where the numbers don't exist. The 2026 report everyone quotes carries no cost per thousand impressions. There is no published LinkedIn benchmark. And the widely repeated figure for how much of a campaign's result comes from the creative has no traceable primary source. We left all three out instead of borrowing them from a roundup.
How much do Facebook ads cost in 2026?
A Facebook click costs $0.60 on the traffic objective and $1.80 on the leads objective, and a lead itself averages $27.39 across all industries [1]. The objective you pick moves the click price by a factor of 3.0.
That factor is the biggest single reason two honest pages quote different prices for the same platform. A traffic campaign asks Meta for the cheapest clicks it can find. A leads campaign asks it to find people who will fill in a form, and those clicks cost three times as much.
Click-through rates move with the objective too. Traffic campaigns average 1.93% and leads campaigns 2.70% [1]. Leads campaigns then convert 8.54% of their clicks [1], which is the number that turns a click price into a lead price, with one wrinkle we come back to in the method section.
| Objective | CTR | Cost per click | Conversion rate | Cost per lead |
|---|---|---|---|---|
| Traffic | 1.93% | $0.60 | not reported | not reported |
| Leads | 2.70% | $1.80 | 8.54% | $27.39 |
All-industry Facebook and Instagram averages for 2026 [1]. The report gives no conversion rate and no cost per lead for traffic campaigns, which is why those two cells are empty rather than filled with something from elsewhere.
Year on year, every one of those prices fell. The traffic click came down from $0.70, the leads click fell 6.25% from $1.92, and the cost per lead slipped from $27.66 [1]. One year of movement in one advertiser base is a direction and not yet a trend, and three small falls like these could come from a handful of large advertisers leaving the base.
How much do Facebook ads cost per month?
A month of Facebook ads costs whatever you set, so the useful question is what the budget buys: $1,000 a month is about 556 leads-objective clicks or about 37 leads at the 2026 benchmark [1].
The rule behind the whole table is two divisions. Clicks equal budget divided by cost per click, and leads equal budget divided by cost per lead. Both inputs are published averages. You can check any cell in seconds.
| Monthly budget | Facebook clicks, traffic | Facebook clicks, leads | Facebook leads | Search clicks | Search leads |
|---|---|---|---|---|---|
| $500 | 833 | 278 | 18 | 92 | 7 |
| $1,000 | 1,667 | 556 | 37 | 185 | 15 |
| $2,500 | 4,167 | 1,389 | 91 | 461 | 37 |
| $5,000 | 8,333 | 2,778 | 183 | 923 | 75 |
| $10,000 | 16,667 | 5,556 | 365 | 1,845 | 150 |
| $25,000 | 41,667 | 13,889 | 913 | 4,613 | 375 |
Facebook columns divide the budget by $0.60, $1.80 and $27.39 [1]. Search columns divide it by $5.42 and $66.69, the all-industry averages from the same publisher's 2026 search report, which covers Google Ads and Microsoft Ads together [3]. Results are rounded to the nearest whole click or lead.
Read the table as a rate card and not as a forecast. It assumes clicks and leads scale straight up with spend, and they don't: push more money into the same audience and the auction charges you more for it.
Is $500 enough for Facebook ads?
$500 a month is enough to test Facebook ads and not enough to measure them. At the benchmark it buys about 278 leads-objective clicks and about 18 leads [1].
Eighteen leads will tell you whether the form works and whether anyone wants the offer. It won't tell you a conversion rate with any confidence, and it won't separate one creative from another.
Here's a useful sanity check that works on any budget. Push the same 278 clicks through the published 8.54% conversion rate and you get about 24 leads, not 18. Two numbers from the same report, six leads apart. We use the lower one everywhere in this post, because fewer leads per dollar is the safer figure to plan against.
Whether 18 leads a month pays back depends on the close rate and the deal size behind them, and we found no source that prices either one. So the arithmetic hands over to you at that point instead of inventing a return.
What do Facebook ads cost by industry?
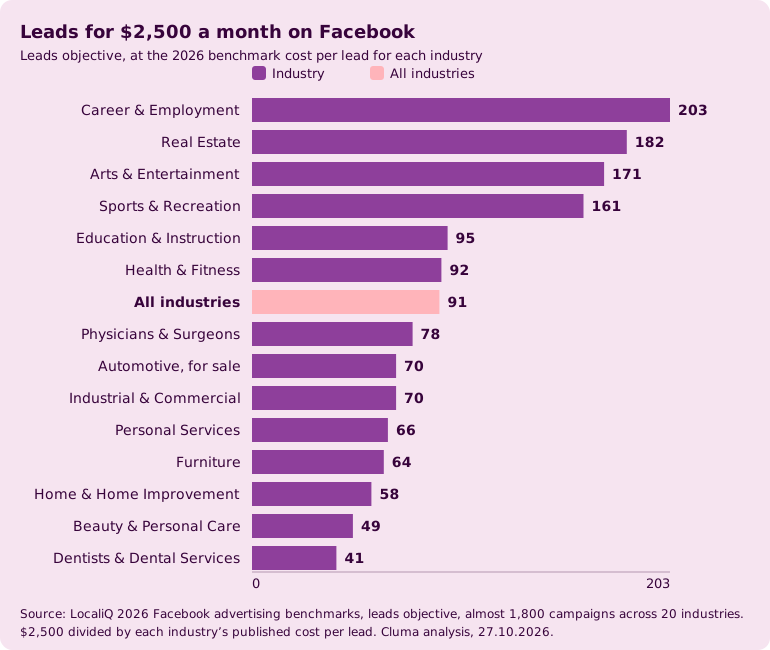
Cost per lead on Facebook runs from $12.30 in Career & Employment to $61.56 in Dentists & Dental Services, a factor of 5.0 [1]. The same $2,500 a month buys 203 leads in the cheapest industry and 41 in the dearest.
The industry you advertise in moves cost per lead further than anything else measured here. It beats the objective split, and it beats the gap between Facebook and search.
| Industry | Cost per click | Conversion rate | Cost per lead | Implied cost per lead | Leads for $2,500 |
|---|---|---|---|---|---|
| Career & Employment | $0.73 | 5.38% | $12.30 | $13.57 | 203 |
| Real Estate | $1.27 | 9.95% | $13.74 | $12.76 | 182 |
| Arts & Entertainment | $0.88 | 15.31% | $14.59 | $5.75 | 171 |
| Sports & Recreation | $1.08 | 6.75% | $15.49 | $16.00 | 161 |
| Education & Instruction | $1.72 | 15.87% | $26.31 | $10.84 | 95 |
| Health & Fitness | $1.84 | 7.98% | $27.11 | $23.06 | 92 |
| All industries | $1.80 | 8.54% | $27.39 | $21.08 | 91 |
| Physicians & Surgeons | $1.68 | 6.41% | $32.14 | $26.21 | 78 |
| Automotive, for sale | $2.01 | 4.15% | $35.52 | $48.43 | 70 |
| Industrial & Commercial | $1.55 | 4.50% | $35.87 | $34.44 | 70 |
| Personal Services | $1.62 | 6.61% | $38.09 | $24.51 | 66 |
| Furniture | $2.18 | 5.66% | $39.25 | $38.52 | 64 |
| Home & Home Improvement | $2.18 | 5.32% | $42.95 | $40.98 | 58 |
| Beauty & Personal Care | $2.97 | 5.63% | $50.91 | $52.75 | 49 |
| Dentists & Dental Services | $5.70 | 6.07% | $61.56 | $93.90 | 41 |
Leads objective, 14 industries, sorted by cost per lead [1]. Cost per click, conversion rate and cost per lead are all published. The two right-hand columns are ours: implied cost per lead is the click price divided by the conversion rate, and the last column is $2,500 divided by the published cost per lead.
Those two cost-per-lead columns should match and they never do. That gap is the most useful thing in the table and the method section takes it apart row by row.
Traffic campaigns sit in a much tighter band. Across 22 industries the traffic click runs from $0.34 to $0.86, a spread of 2.53x against the 5.0x on cost per lead [1].
| Industry | Cost per click, traffic |
|---|---|
| Arts & Entertainment | $0.34 |
| Travel | $0.42 |
| Restaurants & Food | $0.45 |
| Beauty & Personal Care | $0.50 |
| Animals & Pets | $0.51 |
| Industrial & Commercial | $0.54 |
| Real Estate | $0.55 |
| Shopping, Collectibles & Gifts | $0.59 |
| Sports & Recreation | $0.59 |
| Dentists & Dental Services | $0.61 |
| Physicians & Surgeons | $0.61 |
| Home & Home Improvement | $0.63 |
| Furniture | $0.64 |
| Health & Fitness | $0.64 |
| Personal Services | $0.67 |
| Attorneys & Legal Services | $0.69 |
| Automotive, for sale | $0.70 |
| Business Services | $0.70 |
| Education & Instruction | $0.70 |
| Apparel, Fashion & Jewelry | $0.71 |
| Automotive, repair, service & parts | $0.74 |
| Finance & Insurance | $0.86 |
Traffic objective, all 22 industries the report breaks out, cheapest first [1].
The two tables disagree about who has it easy, and that's worth knowing before you pick a benchmark. Arts & Entertainment has the cheapest traffic click at $0.34 and the third cheapest lead at $14.59. Dentists pay $0.61 for a traffic click, mid-table, and $61.56 for a lead, the highest of any industry measured. Same platform, opposite ends.
So a cheap click tells you very little about a cheap lead. Benchmark a campaign against its own objective and its own industry, never against the all-industry line.
How we calculated what a budget buys
Every number in this post is either quoted from a named source or one division you can redo: budget divided by a cost per click, or budget divided by a cost per lead. There's no model, no coefficient and nothing fitted.
The one piece of analysis worth your attention is a consistency check on the benchmark itself. A cost per click divided by a conversion rate is a cost per lead. For all industries that gives $1.80 divided by 8.54%, which is $21.08. The report publishes $27.39. Divide one by the other and the published figure is 30% above its own implied value.
Both numbers can be correct. Averages of ratios taken across different sets of campaigns do not have to agree with the ratio of the averages, and a benchmark report is full of exactly that. We use the published $27.39 throughout, because it is the higher of the two and therefore the safer one to budget against.
Per industry the gap gets wider instead of narrower. Not one of the 14 rows reconciles. The published figure runs from 34% below its implied value in Dentists & Dental Services to 154% above it in Arts & Entertainment, and nine of the 14 sit above.
The two industries with the highest published conversion rates carry the two largest gaps: Arts & Entertainment at 15.31% and Education & Instruction at 15.87%. That pattern is named here and not explained, because the underlying campaign data isn't public.
The practical rule that falls out of it is short. Use the published cost per lead for your industry, and keep the implied figure as a check on it instead of as an input.
The same check on the search side nearly passes. $5.42 divided by 8.18% is $66.26, against a published $66.69, about 1% apart [3]. Same publisher, different report, and neither page explains why one holds together and the other does not. The same arithmetic sits under our web design cost calculator, and the rest of our sourced numbers are on the reports page.
Eight assumptions sit under every table above. Each one has its value, so you can disagree with it precisely.
- Benchmarks are averages from one advertiser base. Every figure here is the mean of one PPC management company's own client accounts, not of Facebook advertisers at large. A single account can sit anywhere around it.
- The published cost per lead is used, not the implied one. $27.39, not $21.08. It's 30% higher and therefore the conservative choice.
- A month is treated as a flat budget. No learning phase, no seasonal auction pressure and no creative fatigue enter the arithmetic.
- Clicks and leads scale linearly with budget. In practice they don't, because the auction charges more as you crowd the same audience. The tables are benchmark-rate projections.
- A lead is the platform-counted conversion the campaign optimised for. It isn't a qualified pipeline opportunity.
- Facebook figures cover Facebook and Instagram placements as the report reports them, weighted to the US.
- The search figures cover Google Ads and Microsoft Ads together, on the search network. Search sells different intent from paid social, so the comparison is about price per unit and not about which channel is better.
- Rounding. Clicks and leads to the nearest whole unit, half rounded up. Ratios to two decimals, with a trailing zero dropped. Shares of a media budget, and the gaps between a published figure and its implied value, to the nearest whole percent.
Facebook vs Google vs LinkedIn: what a lead costs on each
A lead costs $27.39 on Facebook and $66.69 on search, so the search lead runs 2.43x the Facebook one at the all-industry average [1][3]. On clicks the gap is wider still, $5.42 against $1.80, or 3.01x.
| Channel | Cost per click | Cost per lead | Conversion rate | Source and sample |
|---|---|---|---|---|
| Facebook Ads, leads objective | $1.80 | $27.39 | 8.54% | LocaliQ 2026, almost 1,800 campaigns, 20 industries [1][2] |
| Google and Microsoft search ads | $5.42 | $66.69 | 8.18% | WordStream by LocaliQ 2026, thousands of campaigns, 20 industries, April 2025 to March 2026 [3] |
| LinkedIn Ads | no published benchmark | no published benchmark | no published benchmark | see below |
Where both reports break out the same industry the ratio holds up. Arts & Entertainment costs $14.59 a lead on Facebook and $26.84 on search, a factor of 1.84 [1][3].
Conversion rates are the surprise. They sit almost on top of each other, 8.54% on Facebook leads campaigns against 8.18% on search [1][3]. The price difference is in the click, not in what happens after it.
That doesn't make Facebook the better buy. Search sells intent that already exists and paid social creates it, so the two channels are not substitutes at equal price. Once the click lands, the lever you control is the page it lands on, which is where what better UX does to lead conversion comes in.
The LinkedIn row is empty on purpose. LinkedIn publishes no ad-cost benchmark, and we found no independent study of one. The most detailed dataset anywhere is one agency's own book of client accounts, which is fine as a cross-check and not enough to print as a benchmark for a whole platform. So the row says what we know, which is nothing with a method behind it.
Are Facebook ads worth paying for?
On price alone, Facebook ads are the cheaper way to buy a lead: $27.39 against $66.69 on search, 2.43x apart at the all-industry average [1][3].
Worth needs a second number though, and that is the value of the lead. Nothing verified for this post prices a lead in any industry, so the question does not get a figure here.
You can finish it in a minute. Take the leads for your budget from the table above, multiply by the share of leads that close and by the average deal size, and set the total against the spend. An answer built on numbers from your own CRM beats any benchmark on this page.
What do Facebook ads cost per 1,000 impressions?
This post carries no cost per thousand impressions, because the 2026 benchmark report everyone quotes contains none [1]. It mentions the metric once, in a sentence about broader audiences lowering it, with no figure attached.
Every CPM we could find traces back to an ad tool dashboard, a vendor blog or a statistics roundup with no stated sample and no method. A number like that can be right and you still can't check it, so none of them cleared the bar set for this post.
Use cost per click and cost per lead instead. Both are published with a sample size in view, both move with the objective, and a monthly budget converts into them with one division. An impression price only helps once you know what an impression is worth to you.
Why your Facebook ad costs differ from the benchmark
Your costs differ from the benchmark because the auction prices predicted performance and not the bid alone. Meta's own developer documentation puts it plainly: Facebook evaluates your bid strategy, bid amount, and the probability of acquiring your optimization goal to calculate an effective bid [4].
The same page adds that when a bid amount is set, the actual cost per result is usually around or less than that amount, depending on the bid strategy [4]. So the dollar you name sets the level, and the auction decides what actually lands around or under it.
Three of the things that move your position under that ceiling are already measured in this post, with sizes attached.
- Objective, a factor of 3.0. $0.60 a click on traffic against $1.80 on leads [1].
- Industry, a factor of 5.0 on cost per lead. $12.30 in Career & Employment against $61.56 in Dentists & Dental Services [1].
- Channel, a factor of 2.43 on cost per lead. $27.39 on Facebook against $66.69 on search [1][3].
Audience size, placement, season and the ad itself all move the price too. None of them can be sized from the sources here, so this post leaves them unsized. Three measured factors with numbers on them beat ten listed without. That's the trade.
Where this breaks
Six limits apply to everything above, and they're worth reading before you quote a figure from this page.
- The benchmarks are one company's advertiser base. Almost 1,800 campaigns across 20 industries is a real sample with a real method, and it still isn't a census of Facebook advertising [2]. The publisher sells PPC management.
- The report disagrees with itself by 30% on cost per lead, and per industry by anything from 34% below to 154% above the value its own click price and conversion rate imply [1]. We use the published figures and show the gap, which is the most honest available option and not a fix.
- Clicks and leads do not scale linearly with budget, and every row of the budget table assumes they do. Real auctions charge more as you push harder into the same audience, so the larger budgets in the table above are its most optimistic rows.
- A platform-counted lead is not pipeline. Form fills include duplicates, mistakes and people who will never buy, and the report counts them all.
- There is no CPM here, because no source with a stated sample publishes one for Facebook. An impression price has to come from your own account.
- There's no LinkedIn figure here either, for the same reason. Any single number in circulation for LinkedIn ad costs comes from one vendor's clients.
One more limit sits outside the data. These are 2026 averages and auction prices move, so a figure on this page is a dated measurement and not a current quote.
What the ad creative costs, and when a subscription is the wrong call
The one sourced link between an ad and its price sits in Meta's documentation, and it is the probability of acquiring your optimization goal inside the effective bid [4]. Whatever raises that probability moves what you pay. No percentage is attached here to the creative's share of it, because the figure everyone quotes for that has no readable primary source.
What we can price is the design itself. Cluma runs paid-marketing creative as the Run module at a flat $3,995 a month, covering social ads, banner ads, A/B variants, retention ads, motion ads and mail templates [5]. Set that against the media budgets from the table above.
| Monthly media budget | Benchmark Facebook leads | Design, one month | Design as a share of media |
|---|---|---|---|
| $2,500 | 91 | $3,995 | 160% |
| $5,000 | 183 | $3,995 | 80% |
| $10,000 | 365 | $3,995 | 40% |
| $25,000 | 913 | $3,995 | 16% |
| $50,000 | 1,825 | $3,995 | 8% |
Leads are the media budget divided by the all-industry benchmark cost per lead of $27.39 [1]. The design column is Cluma's published price [5] and the last column is that price divided by the media budget, to the nearest whole percent.
The two lines cross at $3,995 a month of media. Spend less than that and a flat monthly design subscription costs more than the ads it feeds, which is hard to justify on any reading.
At that end, buy the layout once. A freelancer per asset, or whoever already holds your brand files, is the better instrument, and our breakdown of what a graphic designer costs prices that route. Between about $4,000 and $10,000 of monthly media it's a judgement call that turns on how many variants you actually ship.
A subscription starts earning its keep when the media bill runs into five figures a month, when new variants ship every week instead of every quarter, and when paid creative is one of several design streams on the same board. At $25,000 of media the design is 16% of the spend and buys unlimited requests queued one at a time, unlimited revisions, and progress roughly every 48 hours on each one [5].
Two things this does not do. It doesn't lower your cost per click or your cost per lead, and nothing in this post or anywhere we could verify says design work does. And Cluma designs the creative without buying the media or managing the accounts, so the campaign stays yours.
If the creative is the bottleneck rather than the budget, that's the part worth fixing first. Cluma's SaaS ad creative module turns briefs into ad sets at a flat monthly price, with billing that stops the day you pause.
References
- LocaliQ, Facebook Ads Benchmarks for 2026. Read 27.10.2026. Scope: Facebook and Instagram paid social, US-weighted, split by campaign objective. Source of every Facebook figure in this post: the traffic objective at 1.93% CTR and $0.60 CPC, the leads objective at 2.70% CTR, $1.80 CPC, 8.54% conversion rate and $27.39 cost per lead, the prior-year comparisons, the 22-industry traffic CPC table and the 14-industry leads table of CPC, conversion rate and cost per lead. Labelled weak, and load-bearing anyway: no government series or research firm publishes Facebook ad prices, so this is the most methodologically transparent source that exists for them. Limitations: the publisher sells the service it benchmarks, the advertiser base is its own clients rather than a random sample, the page carries no confidence intervals, the report contains no CPM, and its own cost per lead sits 30% above the figure implied by its cost per click and conversion rate.
- LocaliQ, Facebook Ads Benchmarks for 2026: Trends & Insights for Your Industry. Read 27.10.2026. Used here for one thing only, the sample statement: the data covers almost 1,800 campaigns run across 20 industries. Limitation: the full report sits behind a lead form, so the sample statement is all that could be read, and the page gives no date range for the campaigns and no breakdown of the sample by industry.
- Search Engine Journal, What Are Good Google Ads Benchmarks In 2026?. Read 27.10.2026. Scope: thousands of Google Ads and Microsoft Ads campaigns across 20 industries, April 2025 to March 2026. Source of the $5.42 all-industry cost per click, the $66.69 cost per lead, the 8.18% conversion rate, and the $26.84 cost per lead for Arts & Entertainment. Limitations: it is a report about one vendor’s advertiser base read through a second publisher, the figures blend Google and Microsoft inventory, and the primary page at wordstream.com could not be opened directly, so the numbers were read on Search Engine Journal and not on the original.
- Meta, Marketing API: Bidding Overview. Read 27.10.2026. Source of the effective bid calculation, that Facebook evaluates bid strategy, bid amount and the probability of acquiring the optimization goal, and that an actual cost per result is usually around or less than a set bid amount. Limitations: the page documents the API rather than the auction's internals, and it carries no prices.
- Cluma, uRun and pricing, both read 27.10.2026. Source of the Run module at $3,995 a month covering social ads, banner ads, A/B variants, retention ads, motion ads and mail templates, one active request at a time with unlimited requests queued, unlimited revisions while subscribed, progress roughly every 48 hours until each request is finished, pause anytime with billing stopping immediately and unused days banked, and modules priced from $2,995 to $4,995 a month. Disclosure: Cluma publishes this post and sells one of the two options compared above. Cluma designs ad creative and does not buy media or manage ad accounts.