



AI will not replace graphic designers as an occupation, but it has already changed the official forecast: the US Bureau of Labor Statistics now projects graphic designer employment to decline 2 percent from 2025 to 2035, and it names automated design tools such as AI as a reason [1]. One annual update earlier, the same government page projected 2 percent growth [2].
That pairing is the finding, and it comes from one page read twice. We put the live BLS occupation page next to an archived copy of itself from 1 December 2025, and the two versions disagree about the direction of the whole occupation.
Alongside the projection you get two surveys of designers, run by the companies whose tools they use: Figma in 2025 [3] and Adobe in March 2023 [4].
There's one number you won't find below. The World Economic Forum ranking that most articles on this question quote is absent, because we could not read it inside the Forum’s own report, and Where this breaks says why.
Is AI replacing graphic design jobs?
AI isn't emptying the occupation, and it has moved into the government’s own projection. The federal outlook for graphic designers went from 2 percent growth to a 2 percent decline in one annual update, a swing of 4 percentage points [1][2].
BLS also rewrote the sentence it uses to explain that, and you should read both versions word for word.
The 2024 to 2034 page said automated design tools such as artificial intelligence “may reduce the need for companies to contract with freelance graphic designers” [2]. The 2025 to 2035 page says they “are projected to make graphic designers more productive and reduce the need for these workers” [1].
So the claim grew from freelance contracting to the occupation, and from may to projected. If you buy design work, that widening is the part aimed at you.
Something else moved too: the hedge changed sides. In the older version, the optimistic sentence about companies increasing their digital presence was the main claim, and the AI sentence was the exception that followed it.
In the current version those roles are reversed. AI carries the statement now, and the digital presence sentence is the one that starts with however [1][2].
| What BLS published | 2024 to 2034 cycle, page as of 1 December 2025 | 2025 to 2035 cycle, page as of 27 October 2026 | What moved |
|---|---|---|---|
| Projected employment change | Grow 2 percent [2] | Decline 2 percent [1] | A 4 percentage point swing |
| Base-year employment | 265,900 jobs in 2024 [2] | 253,100 jobs in 2025 [1] | 12,800 fewer, down 4.8 percent |
| Projected openings a year | About 20,000 [2] | About 16,000 [1] | 4,000 fewer a year, down 20 percent |
| Where those openings come from | Most come from replacing workers who leave [2] | All come from replacing workers who leave [1] | Growth now contributes none of them |
| What AI is said to do | May reduce the need to contract with freelance graphic designers [2] | Projected to raise productivity and reduce the need for these workers [1] | From freelance contracting to the occupation, and from may to projected |
| Which sentence carries the hedge | The AI sentence [2] | The digital presence sentence [1] | The two swapped places |
| Median annual wage | $61,300 in May 2024 [2] | $62,960 in May 2025 [1] | Up $1,660, or 2.7 percent |
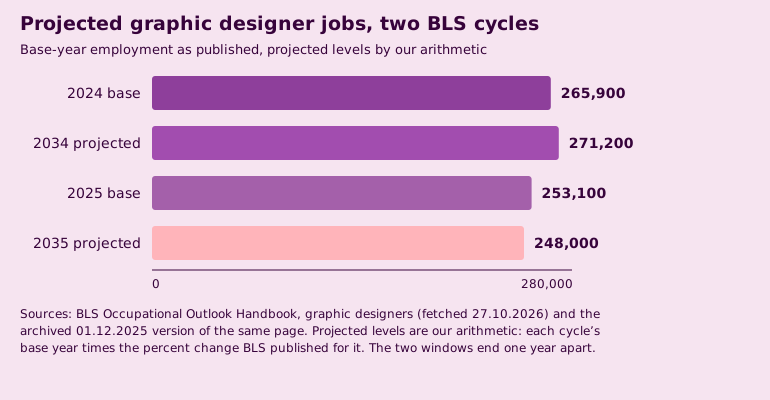
| Projected end-of-decade level, calculated here | About 271,200 in 2034 | About 248,000 in 2035 | About 23,200 apart |
| Projection window | 2024 to 2034 | 2025 to 2035 | The end points are one year apart |
One BLS occupation page, one annual update apart. Every row is BLS’s except the second from last, which is our arithmetic, and you can redo it in a minute.
The rule we used: take each cycle’s published base year, multiply by the percent change BLS published for that cycle, round to the nearest hundred. So 265,900 times 1.02 gives about 271,200 jobs for 2034, and 253,100 times 0.98 gives about 248,000 for 2035.
Those two projected end points sit about 23,200 jobs apart. BLS does not publish the levels in that form, so treat them as a calculation and not as a federal figure.
One honesty note belongs right here, because it decides how much weight the comparison can carry. This is one source at two dates, not two independent bodies agreeing.
What it shows is that BLS changed its mind. That's a fact about the forecast, not a measurement of what AI did to anybody’s job.
Worth adding: the older page already mentioned AI. We expected it wouldn't, and a word search through the archived text proved otherwise, so what's new in this cycle is the reach of the claim and not the subject of it.
What is the graphic designer job outlook for 2025 to 2035?
The graphic designer job outlook for 2025 to 2035 is a 2 percent decline from a base of 253,100 jobs, with about 16,000 openings projected each year and a median annual wage of $62,960 as of May 2025 [1].
A shrinking occupation and a steady stream of openings sound contradictory. They aren't, and one division shows you why.
Two percent of 253,100 is about 5,100 jobs over the ten years, which is roughly 506 a year. Set that against 16,000 openings a year and the decline removes about three jobs for every hundred openings.
Over the full decade that's about 160,000 openings against a net loss of about 5,100 positions. Whichever side of the desk you're on, that ratio is the one to carry away.
So the occupation is forecast to get smaller while it keeps hiring at a pace that dwarfs the shrinkage. If you're deciding whether to hire, that gap matters to you more than the minus sign does.
And if you're the designer reading this, it's the number that says the door is still open.
For what those hires cost, our report on what US employers pay graphic designers works through the full wage distribution.
How many graphic designers are there in the US?
Graphic designers held about 253,100 jobs in the United States in 2025 [1]. One update earlier, the same page put the count at 265,900 for 2024 [2].
That means the baseline itself fell by 12,800 between updates, before any projection was applied to it.
One scope note matters if you ever set that count against a salary table. BLS’s job count includes self-employed designers, while its wage figures cover employees on a payroll only [1].
They're two different populations. Don't read a wage percentile against a job count in your own planning as though both describe the same group of people.
Are graphic designers high in demand?
Demand for graphic designers is steady rather than high, and it's demand to replace people, not to add them. BLS projects about 16,000 openings a year, and says all of those openings are expected to come from workers transferring to other occupations or leaving the labour force [1].
That word all is new. The previous cycle said most of the openings would come from replacement [2], which left room for growth to supply the rest.
The current wording leaves none. Every projected opening in this occupation is now somebody else’s vacated seat.
If you're hiring, you're hiring into a queue of vacated seats rather than into growth.
What do designers themselves say about AI?
Designers use AI, expect to need it, and trust its output less than developers do.
In Figma’s 2025 AI Report, a survey of 2,500 Figma users, designers reported a 69 percent satisfaction rate with AI tools against 82 percent for developers. On quality, 54 percent of designers said AI improves their work, against 67 percent of developers [3].
On the work that defines the job, that gap widens. Only 31 percent of designers use AI in core design work such as asset generation, while 59 percent of developers use it for core development work such as code generation [3]. That's 28 percentage points.
Across the combined designer and developer sample, 78 percent agreed AI significantly enhances the efficiency of their work, and 32 percent said they can rely on its output [3].
That 46 point distance between speed and trust is the most quotable thing in the report. It belongs to both groups together, though, not to designers alone.
If your plan assumes AI does the work and somebody signs it off quickly, that is the gap your plan is sitting on.
More than 80 percent of designers and developers also said learning to work with AI will be essential to their role in future [3].
Adobe’s survey of 1,000 US creative professionals, published on 21 March 2023, is the one that breaks the answer down by role. Asked whether they'd use generative AI in future professional work, 69 percent of graphic designers and illustrators said yes, against 91 percent of UI and UX designers and 45 percent of print designers and publishers [4].
Only 19 percent of everyone Adobe surveyed had not used a generative AI tool at work at all [4].
| Source and date | What it measures | What it found | Method and scope |
|---|---|---|---|
| BLS, page as of 27 October 2026 [1] | Projected employment, 2025 to 2035 | Decline 2 percent, 253,100 jobs in 2025, about 16,000 openings a year, AI named as a reason | Government projection model, national, all graphic designers including the self-employed. Not a survey, and not a measurement of the future |
| BLS, page as of 1 December 2025 [2] | Projected employment, 2024 to 2034 | Grow 2 percent, 265,900 jobs in 2024, about 20,000 openings a year, AI named only for freelance contracting | The same model and the same page, one annual update earlier |
| Figma, 2025 AI Report [3] | What practitioners do with AI, and how they rate it | 69 percent designer satisfaction against 82 percent for developers, 31 percent against 59 percent on core work, 78 percent on efficiency against 32 percent on reliance | Self-selected survey of 2,500 users of one design tool, published by that tool’s maker. The efficiency and reliance pair covers designers and developers together |
| Adobe, 21 March 2023 [4] | Expected future use of generative AI, by role | 69 percent of graphic designers and illustrators, 91 percent of UI and UX designers, 45 percent of print designers and publishers | 1,000 US creative professionals across eight role groups, published by the vendor, and about three and a half years old |
The official projection next to the practitioner surveys. Each row names its method on purpose, because a government projection and a vendor survey answer different questions.
Put the two legs together and you get a pattern neither one states alone. BLS attributes a declining outlook to automated design tools raising productivity, while the designers Figma surveyed mostly don't yet use those tools for core design work.
In other words, the productivity the projection assumes is still largely ahead of the adoption the surveys measure.
If you want to see which tools are actually in use, our review of the AI design tools SaaS teams use and the companion piece on AI prototyping tools both go tool by tool.
Does a graphic designer have a future?
On the official numbers, yes, as a slightly smaller occupation that still opens about 16,000 positions a year [1].
BLS says so on the same page that carries the decline: “However, as companies continue to increase their digital presence, graphic designers are expected to still be needed to help create visually appealing layouts and branding” [1].
Read that against the survey leg and you can see the shape of the risk. Generation is the part of the work surveyed designers have handed to AI, and the judgement about what to generate is the part they haven't.
That's what the two numbers say: 31 percent use AI in core design work, and 32 percent of the combined sample say they can rely on what comes out [3].
Neither finding is a forecast, and we won't turn them into one. What you can take from both sources is that they point the same way on direction and disagree on speed.
Which design jobs will survive AI?
No source in this post measures survival by job type, so this question stays half-answered rather than filled in with opinion.
What does exist is expectation by role, and the spread is wide. Adobe’s 2023 figures run from 91 percent of UI and UX designers down to 45 percent of print designers and publishers, a 46 point spread, with graphic designers and illustrators at 69 percent [4].
That tells you where practitioners expected AI to become part of the work, by role, in early 2023. It doesn't tell you who keeps a job, and it won't tell you which of your own roles is exposed.
Treating it as a survival ranking would mean reading a sentiment survey as a labour market forecast, and you'd be the one holding the conclusion.
Where will graphic design be in 10 years?
The only sourced ten-year answer available is BLS’s own horizon: about 248,000 jobs in 2035 against 253,100 in 2025, by the multiplication above, with roughly 16,000 openings a year along the way [1].
On pay, the same page moved its median up 2.7 percent between the two cycles, from $61,300 in May 2024 to $62,960 in May 2025 [1][2]. That is the whole of what you can source on a ten-year view.
Everything past that horizon is opinion, ours included. Honest size of the claim: one decade, one country and one occupation code, from a model that just revised itself by 4 percentage points.
Where this breaks
Eight limits, each one true of the numbers above.
- The before-and-after is one source at two dates. Both columns of the first table are BLS, and they are not two independent bodies that happened to reach the same conclusion.
- A projection is not a measurement. This post is itself the evidence: one annual revision moved the same occupation by 4 percentage points [1][2].
- The two cycles cover different windows. One runs 2024 to 2034 and the other 2025 to 2035, so the end points are a year apart and the bars in the chart aren't one continuous series.
- The projected job levels are calculated, not published. About 271,200 and about 248,000 come from multiplying each published base year by its published percent change, and BLS publishes the percent and not those levels.
- The World Economic Forum ranking is missing. Its Future of Jobs report is the source most articles cite for graphic design, and we could not read the relevant figure in the Forum’s own document. Its PDF exceeded the fetch limit here, embedded fonts defeated a manual text extraction, and weforum.org refused every direct request from this network. Trade coverage reports the ranking consistently, which is not the same as reading it, so no number from it appears above.
- Figma’s sample is self-selected. It's 2,500 users of one design tool, surveyed and published by the maker of that tool, and the efficiency and reliance pair covers designers and developers together rather than designers alone [3]. Figma’s page also gives the developer quality figure twice, as 68 percent and as 67 percent. We used 67, from the sentence that sets it directly against the designer figure.
- Adobe’s role figures are from March 2023. They're the oldest numbers in this post, roughly three and a half years old and several tool generations back [4].
- The hire column below is wages only. Benefits, recruiting, software and equipment aren't in it, which makes it a floor, not a cost. Our report on what a graphic designer costs fully loaded prices those, and the rest of our sourced work sits on the Cluma reports page.
Hire a designer, use AI tools, or subscribe?
If you came here as an employer rather than as a designer, the projection answers nothing for you on its own. What the median wage gives you is a way to put three options on one axis.
BLS puts that median at $62,960 a year, which is about $5,247 a month before benefits, recruiting, software or equipment [1].
| Option | Per month | Per year | What you get | When it's the better choice |
|---|---|---|---|---|
| Hire a graphic designer | About $5,247 in wages [1] | $62,960 in wages [1] | Full-time dedicated capacity, product context, somebody in your standups | Design work that fills a week every week, all year |
| AI tools alone | Not priced here | Not priced here | Fast generation, with the judgement left to you | High-volume commodity graphics where speed beats judgement |
| Cluma uCreate [5] | $3,495 | $41,940 | Organic content design, one request in progress, unlimited queue and revisions | Social and content design that arrives in bursts |
| Cluma uRun [5] | $3,995 | $47,940 | Paid creative, on the same one-in-progress model | Ad creative that needs refreshing but not a full seat |
| Both modules [5] | $7,490 | $89,880 | Two disciplines running at once, each with its own queue | Organic and paid both moving every week |
Monthly figures times 12 for the annual column, and the wage divided by 12 for the monthly one. Run your own numbers on it.
On wages alone, uCreate runs $21,020 a year under the median and uRun $15,020 under it, while both modules together come to $26,920 above it.
The AI tools row carries no price because we have no verified one to put in it. Inventing a number for a comparison table is exactly the thing this post is about not doing.
A hire wins on a pattern the table can't show. If your design work genuinely fills a full week every week, you want somebody with the product in their head rather than in a brief, and you want them in the room when the roadmap changes, then a salaried designer is the better buy.
Nothing in those rows changes that. Wages are a floor too, so a fair comparison pushes the hire row up and not down.
AI tools alone win where your work is high volume, low stakes and close to identical every time. At that end generation is most of the job and the review is quick, which is the shape the Figma numbers describe: speed is where practitioners agree AI delivers, and reliance is where they don't [3].
What's left is the pattern in between, where your work is senior-level but doesn't fill a seat. That's the gap a graphic design subscription is built for: senior-owned and senior-reviewed work at a flat monthly price, everyday tasks back in about 48 hours, bigger projects moving in milestones with progress roughly every 48 hours, and a pause that stops your billing the day you take it [5].
References
- US Bureau of Labor Statistics, Occupational Outlook Handbook, Graphic Designers, 2025 to 2035 projections and May 2025 wage data, page last modified 27 August 2026, read again on 27.10.2026. Source of the 2 percent projected decline, the 253,100 jobs in 2025, the roughly 16,000 annual openings and the sentence that all of them come from replacement, the $62,960 median annual wage, the automated design tools sentence and the digital presence sentence. Limitations: a projection is not a measurement, BLS revises it every year, and this post documents a 4 percentage point revision in one cycle.
- US Bureau of Labor Statistics, Occupational Outlook Handbook, Graphic Designers, archived snapshot dated 1 December 2025, Internet Archive copy, 2024 to 2034 projections and May 2024 wage data, read 27.10.2026. Source of the 2 percent projected growth, the 265,900 jobs in 2024, the roughly 20,000 annual openings, the sentence that most of them come from replacement, the $61,300 median annual wage and the freelance contracting version of the AI sentence. Main limitation: this is the same source as reference 1 at an earlier date, so the comparison is one page against itself rather than two independent bodies.
- Figma, 2025 AI Report, by Andrew Hogan, Figma’s head of insights, read 27.10.2026. Source of the 69 and 82 percent satisfaction figures, the 54 and 67 percent quality figures, the 31 and 59 percent core-work figures, the 78 percent efficiency and 32 percent reliance pair, and the more than 80 percent who expect AI skills to be essential. Read as raw HTML and parsed by hand, because two earlier summarising fetches of the same report returned figures that disagreed with each other. Limitations: a self-selected survey of 2,500 users of one design tool, published by the maker of that tool. The efficiency and reliance pair covers designers and developers together rather than designers alone. The page also states the developer quality figure twice, as 68 percent and as 67 percent, of which 67 is the figure used above because it is the one set directly against the designer figure in the same sentence.
- Adobe, research on creative professionals and generative AI, published 21 March 2023, read 27.10.2026. Source of the role breakdown on expected future use of generative AI, including 69 percent of graphic designers and illustrators, 91 percent of UI and UX designers and 45 percent of print designers and publishers, and of the 19 percent who had not used a generative AI tool at work. The page states its own sample: 1,000 US creatives across eight role groups. Limitations: published in March 2023, which makes these the oldest figures in this post by roughly three and a half years, published by the vendor, and a sentiment survey and not a labour market measurement.
- Cluma, graphic design subscription, prices cross-checked against pricing, both read 27.10.2026. Source of the uCreate, uRun and combined module prices and of the subscription terms in the options table. Disclosure: Cluma publishes this post and is one of the three options in that table, on the same footing as the hire and the tools.
Two sources were checked and left out on purpose. The World Economic Forum Future of Jobs Report 2025 is quoted by most coverage of this question, and the graphic design figure could not be read inside the Forum’s own document, so no number from it appears above. Adobe’s Creators’ Toolkit Report of October 2025 is excluded on scope, because Adobe’s own methodology paragraph says the study surveyed emerging and semi-professional content creators rather than people working full time as creative professionals. Nothing in this post is taken from a statistics roundup, a vendor summary or an AI answer.