



Private B2B SaaS companies spend a median 22% of ARR on R&D [1], but no public benchmark breaks out the design share of that budget. The design investment statistics that hold up in 2026 describe what design talent costs [4] and what usability work has returned [5].
That is the short answer, and it is less tidy than most statistics pages suggest. Every figure here comes from its primary source (a summary or search snippet never counted), and anything that failed to confirm there is gone.
What remains is a shorter list. Each statistic is one sentence you can quote, with its publisher, date and sample size. Anyone building a budget case or a board slide can lift any row and link back to it, and more sourced data sits on the Cluma reports page.
SaaS design investment statistics at a glance
These are the numbers that passed verification, plus two findings about data that does not exist yet.
| Statistic | Source | Date | Scope |
|---|---|---|---|
| Private B2B SaaS companies spend a median 22% of ARR on R&D. | SaaS Capital [1] | March 2026 | SaaS, 1,000+ companies |
| The SaaS Capital spending benchmark does not break design out as its own line inside R&D. | SaaS Capital [1] | March 2026 | SaaS |
| The public summary of the Zylo SaaS Management Index reports no design-software spend category. | Zylo [2] | Read 22.09.2026 | SaaS software spend |
| Design’s average share of R&D headcount falls with company size, from 13% at 1 to 100 employees to 6% at 3,001+. | Pave [3] | Read 22.09.2026 | R&D headcount, about 233,000 employees at 4,195 companies |
| The median UX salary was $120,000 in 2024, up 10% from $109,000 in 2022. | UXPA [4] | Nov 2024 | UX, N=444, 67% US |
| The median UX salary was $75,000 at companies of 1 to 10 employees and $149,000 at companies of 10,000+. | UXPA [4] | Nov 2024 | UX, n=388 |
| 59% of UXPA survey respondents rate the UX maturity of their company as Considered (30%) or Managed (29%), and 9% as Institutionalized. | UXPA [4] | Nov 2024 | UX, n=404 |
| Of respondents planning to hire in 2025, 72% planned one or two UX hires. | UXPA [4] | Nov 2024 | UX, n=71 |
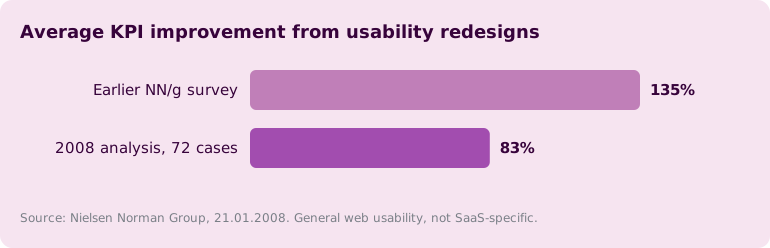
| Usability redesigns improved key performance indicators by an average 83% across 72 case studies, down from 135% in an earlier survey. | Nielsen Norman Group [5] | 21.01.2008 | General web usability |
| Rule of thumb from Nielsen Norman Group: spending 10% of a development budget on usability should improve conversion rate by 83%. | Nielsen Norman Group [5] | 21.01.2008 | General web usability |
How much should a SaaS company spend on design?
Nobody publishes a direct answer. The closest design investment benchmark is the envelope design sits inside. Private B2B SaaS companies spend a median 22% of ARR on R&D, according to the SaaS Capital survey of more than 1,000 companies completed in March 2026 [1]. In that benchmark, design sits inside R&D with engineering and product, and the survey does not split it out [1]. So when a page hands you a confident figure for the share of revenue design should get, ask where it came from before repeating it.
We checked two spending benchmarks that could plausibly carry a design line, SaaS Capital and Zylo, and neither does. When you plan a design budget, say so plainly in the room.
What percentage of revenue goes to product design?
It is not broken out anywhere public.
SaaS Capital folds design into R&D [1]. Zylo's SaaS Management Index reports software spend across organisations, but its public summary has no design-software category [2]. We will not invent a share to fill the gap. A planning number has to come from your own books: add up design salaries, research tooling and any outside design spend, divide by ARR, and call the result an internal estimate.
Is there a benchmark for designers per engineer?
Partly. Pave titles its chart as a Design:Eng ratio, but the figures are design’s share of all R&D headcount.
In the R&D org-structure benchmarks from Pave, design makes up 13% of R&D headcount on average at companies of 1 to 100 employees [3]. The share shrinks as companies grow: 10% at 101 to 500 employees, 8% at 501 to 1,000, 7% at 1,001 to 3,000 and 6% at 3,001 or more [3]. The base is all of R&D, product management and data included.
Those figures sit in a chart on the page and draw on about 233,000 R&D employees at 4,195 companies in Pave's compensation database [3]. They count people. Design cost is outside their scope, and the database is not limited to SaaS. Still, it's the closest public answer on design headcount.
What does design talent cost?
In the 2024 UXPA Salary Survey, the median UX salary was $120,000, up 10% from $109,000 in 2022 [4]. That is a difference of $11,000 over two years, which the survey reports as the 10% rise.
UXPA surveyed 444 UX professionals in 37 countries from April to October 2024, and 67% of them work in the US [4]. Product designers and UX designers dominate its job-title mix, and those are the roles SaaS design budgets pay for, although UXPA does not label the survey SaaS. Salary is the part of design investment that every company can measure, which is why it anchors this page. Use it as the cost of one person. Benefits, tools and management time come on top.

How much should a startup spend on design?
No public benchmark sets a startup design budget. Salary is the only verified cost anchor.
At companies of 1 to 10 employees the median UX salary was $75,000, and at the largest, with 10,000 or more, it was $149,000 [4]. Divide 149,000 by 75,000 and you get 1.99. A designer at the largest companies earns about double what one earns at the smallest. UXPA says the same thing in its own words, describing the small-company median as half that of the largest companies [4].
It tells you what one person costs and says nothing about how many people you need or when to hire them. We've left a recommendation out. If you're weighing a hire against outside help, see how Cluma’s design subscription for startups works, or check a single project quote with the Cluma web design cost calculator.
What is the ROI of UX design?
The strongest public benchmark is the 2008 Nielsen Norman Group analysis of 72 usability case studies, which found an average 83% improvement in the business metrics each project targeted [5]. Its comparison point, an earlier survey, had found 135%. Carry two caveats with the number. It is 18 years old (2026 minus 2008), and it covers general web usability, including e-commerce and intranets, with no SaaS breakout. Nielsen Norman Group also reported that the drop from 135% to 83% was only marginally significant, at p=8% [5]. That same article gives a rule of thumb: spending 10% of a development budget on usability should improve conversion rate by 83% [5]. When quoting it, tell your audience it is an estimate drawn from that 2008 data.
What does bad UX cost a software company?
That one lacks a verified figure too. The loss-side numbers that circulate on rework, support tickets and churn all failed verification for this page. None of them appear here.
Nielsen Norman Group's data runs the other way [5]. It records what improved once usability work was done. For a cost-of-inaction number on your own product, your funnel is the most defensible source: compare conversion before and after a design change.
How mature are UX teams, and are they hiring?
Most UX teams sit in the middle of the maturity ladder.
In the 2024 UXPA survey, 59% of respondents rated the UX maturity of their company as Considered (30%) or Managed (29%), and 9% called it Institutionalized [4]. That question had 404 answers.
Hiring plans were modest. Of the 71 respondents whose companies planned to hire in 2025, 72% expected to make one or two UX hires [4]. With 71 answers, the base is small, so it shows a direction and no more. It's still the only published figure on UX hiring intent for 2025 that we found.
Which design ROI statistics don't hold up?
Several figures appear on almost every design ROI page. You won't find them in the table above, and they aren't repeated here either, because a number does not get more reliable by being printed again. Here is why each one was cut.
- The UX return-per-dollar claim attributed to Forrester. No accessible primary Forrester document could be found behind it, and retellings quote different multiples for the same claim.
- Vendor-commissioned ROI studies. A study paid for by the company selling the tool has a commercial interest in the result. They stay out as a class.
- Single-company case studies. A before-and-after from one client, published by the firm that did the work, is a story, not a benchmark.
Two long-running studies do hold up at their primary sources, and they tell a strong story for design investment: see what McKinsey found in 300 companies and how design-led companies beat the S&P 500 by 211%.
If you're citing design ROI in a deck, the standard applied here is simple: could you open the primary source and find the sentence yourself? If not, your audience can't either, and a sharp CFO will ask.
How were these statistics sourced?
We read each figure at its primary source on 22.09.2026, and for UXPA that meant the PDF itself. Nothing unconfirmed stayed on the page as a vaguer claim.
This is also where the data breaks, and you should know the limits before you quote it:
- Only SaaS Capital is SaaS-specific. Pave covers the companies in its compensation database, and UXPA and Nielsen Norman Group cover UX and web usability broadly [3] [4] [5].
- Pave's design share is headcount, not spend, and it is read from a chart on an undated page [3].
- Nielsen Norman Group's ROI benchmark dates from 2008. This research turned up no newer study of comparable breadth [5].
- UXPA figures are self-reported, and with 67% of respondents in the US, salaries skew toward US pay levels [4].
- UXPA's hiring figure rests on 71 answers. It points to direction only [4].
- Absence findings can age. A benchmark that adds a design line next year would change the first section of this page.
We'll update these design investment statistics when a source publishes a new edition. Cite the original source for any row you use from the table, and link here for the context around it.
Cluma runs product and website design for SaaS teams as a subscription, with progress roughly every 48 hours. You can browse every design service, and if your design budget needs to go further, see Cluma subscription pricing.
References
- SaaS Capital, Spending Benchmarks for Private B2B SaaS Companies. Annual survey completed March 2026, more than 1,000 SaaS companies responding. Scope: SaaS. Weakness: design is not broken out within R&D.
- Zylo, SaaS Management Index, public summary, read 22.09.2026. Scope: organisational SaaS spend. Vendor-published. Cited only for what it does not report.
- Pave, R&D Org Structure Benchmarks, read 22.09.2026, page undated. About 233,000 R&D employees at 4,195 companies in Pave's compensation database. Design's average share of R&D headcount by company size (13% at 1 to 100 employees down to 6% at 3,001+) is read from the chart on that page. Weakness: vendor-published, headcount only, not SaaS-specific.
- UXPA International, 2024 UXPA Salary Survey (PDF), November 2024. N=444, 37 countries, 67% US, fielded April to October 2024. Weakness: self-reported, not SaaS-labelled, some sub-questions have small bases.
- Nielsen Norman Group, Usability ROI Declining, But Still Strong, 21.01.2008. 72 case studies. Weakness: 18 years old, general web usability, not SaaS.


