


How much does a billboard cost? Across the two largest publicly traded US billboard operators, the average billboard display earned $1,326 per four-week period in 2025, from $447 for a poster to $17,328 for a digital bulletin [1][2]. That's not a rate card. It's what advertisers actually paid.
Both numbers come out of two Form 10-K filings lodged with the SEC, divided by the displays those same filings count. Lamar Advertising and OUTFRONT Media together report 197,540 billboard displays and $3,405.2 million of billboard revenue for 2025 [1][2].
Nobody publishes that division, so you get all of it below. The display counts, the revenue splits, the arithmetic line by line, seven assumptions with their values, and the two places our reading of the filings could be wrong.
One warning before you budget off $1,326. An average across a national portfolio sits below the price of a board you'd actually want, because every unsold display counts in the denominator and earns nothing. So read it as the middle of a very wide range, and read the range as the real answer.
How much does a billboard cost per four-week period?
A billboard costs between $447 and $17,328 per four-week period, and $1,326 at the blended average across 197,540 displays [1][2]. Format and market decide where in that range you land.
The low end is a static poster in Lamar’s portfolio, which is national and highway-weighted. The high end is a digital billboard in OUTFRONT’s, which is weighted to the largest metros: Los Angeles, New York and Miami are its three biggest billboard markets [2].
Every figure is 2025 revenue divided by the displays that earned it, then divided by 13 four-week periods, because that period and not the calendar month is the unit out-of-home sells in. The OAAA says posters go out in GRP programs of four to 52-week units [3], and digital billboards from one week upward [4].
Which means the honest answer for your buy is a range by format, and the gap between the cheapest format and the dearest is a factor of 38.8. If a page quotes you one national billboard price, it is averaging across that factor without telling you.
Here's the whole table, so you can find your own format in it. The arithmetic behind it is in the next section but one.
| Operator | Format | Displays | 2025 revenue | Per display, a year | Per display, 4 weeks |
|---|---|---|---|---|---|
| Lamar | Poster (static) | 79,700 | $463.2M | $5,811 | $447 |
| Lamar | Bulletin (static) | 74,100 | $919.0M | $12,403 | $954 |
| Lamar | Bulletin (digital) | 5,500 | $631.6M | $114,836 | $8,834 |
| OUTFRONT | Billboard (static) | 36,312 | $957.1M | $26,358 | $2,028 |
| OUTFRONT | Billboard (digital) | 1,928 | $434.3M | $225,259 | $17,328 |
| Both | All billboard displays | 197,540 | $3,405.2M | $17,238 | $1,326 |
Display counts and revenue are from the two FY2025 Form 10-Ks [1][2]. The last column is the one before it divided by 13.
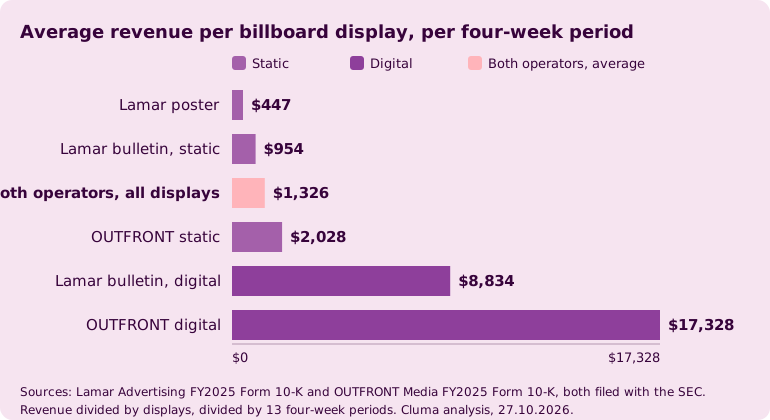
What you're looking at is yield, not a quote. It is the average rent each display pulled in over a year, spread across every board in the portfolio, the sold ones and the empty ones together.
That makes it a floor for planning. A board you'd pick on purpose, on the road you want, in the month you want, costs more than the average of all of them.
How much more than the average, neither of the two filings says anywhere.
How much does it cost to use a billboard for a day?
There's no day rate, because nobody sells a day. The shortest contract the OAAA records for a digital billboard is one week [4], posters go out in units of four weeks and up [3], and permanent bulletins usually run six months or longer [5].
You can still do the division, as long as you know what it is. Take the printed figures above over 28 days: a poster works out at $15.96 a day, the blended average at $47.36, and an OUTFRONT digital board at $618.86. That's arithmetic on an average, not an offer. No operator will sell you one twenty-eighth of a period at it.
What does a bulletin, a poster and a digital billboard each cost?
A static bulletin averaged $954 per four-week period at Lamar and $2,028 across OUTFRONT’s static inventory. A poster averaged $447. A digital bulletin averaged $8,834 at Lamar and $17,328 at OUTFRONT [1][2].
Format is the biggest thing you control here, so it pays to know what you're buying.
Bulletins are the large roadside structures most people mean by billboard. The OAAA lists the common live copy areas as 14ft high by 48ft wide, 10ft by 40ft and 10ft 6in by 36ft, with negotiated spectaculars at 20ft by 60ft and 16ft by 60ft [5].
Rotary bulletins get moved to new pre-approved locations roughly every 60 days. Permanent ones stay put for the contract and are priced individually on location and audience delivery [5].
Posters are the smaller panels on local arterial roads, 125in by 272in overall, bought by market coverage instead of site by site and reposted every 60 to 90 days [3]. They are the cheapest way onto a street, at roughly a third of what a static bulletin averages.
Digital billboards are the same physical sizes as conventional ones, with your artwork in a loop: messages change every six to eight seconds and typically six to eight advertisers share the location [4]. You're renting a slot in a rotation, not the whole face.
The money follows that split. At Lamar, one digital display earned 19.8 times what one poster did, and 9.26 times what one static bulletin did [1]. At OUTFRONT the digital-to-static ratio is 8.55 [2].
OUTFRONT puts its own number lower. Its filing says digital billboard displays generate approximately four to five times more revenue per display on average than comparable traditional static billboard displays [2].
We are not going to force those two to agree, because they measure different things. The word doing the work in OUTFRONT’s sentence is comparable: a digital board against a static board in the same sort of location.
Our 8.55 blends a whole national portfolio, and digital boards get built where the traffic was already worth the most. So treat four to five times as the like-for-like upgrade, and 8.55 as the portfolio-level gap.
How we calculated these billboard costs
Five steps, all of it arithmetic you can redo with the two filings open in front of you.
Step 1, the display counts. Lamar reports approximately 159,300 billboard displays, of which approximately 5,500 are digital, and breaks the structures out as approximately 79,600 bulletins and 79,700 posters [1].
Those two add to 159,300, the whole billboard total, so the digital displays have to sit inside them and not alongside. Digital boards are bulletin-class structures, and Lamar’s digital sizes in the same filing are bulletin sizes, so we read the 5,500 as part of the 79,600 bulletins. Static bulletins are therefore 79,600 minus 5,500, which is 74,100.
Step 2, the check that earns the reading. Static bulletins of 74,100 plus 79,700 posters is 153,800. A different table in the same filing, the geographic diversification table, counts 153,801 static billboard displays [1].
One display apart, out of 153,801. Had the digital boards been counted on top of the bulletins, that table would have shown roughly 159,300 instead. Two independently reported numbers agreeing to 0.0007% is what makes step 1 safe to build on.
Step 3, the revenue split. Lamar’s geographic table gives static billboard revenue of $1,382.2 million and digital billboard revenue of $631.6 million, which add to the $2,013.8 million of billboard revenue in its accounts [1].
The filing separately states that approximately 77% of billboard advertising net revenues came from bulletin rentals and 23% from poster rentals [1]. That gives bulletins including digital at 0.77 times $2,013.8 million, or $1,550.6 million, and posters at 0.23 times $2,013.8 million, or $463.2 million, with nothing left over. Take the digital $631.6 million out of the bulletin line. Static bulletins come to $919.0 million.
One thing we will not dress up as a check. Static bulletins of $919.0 million plus posters of $463.2 million do come to exactly the $1,382.2 million of static revenue in the table, which looks like confirmation.
It isn't. Since 77% and 23% add to 100%, subtracting digital from one share and adding the other always returns the total minus digital. The identity holds whatever the digital figure is, so it proves nothing. The real check is the display count in step 2.
Step 4, OUTFRONT. Simpler, because there is no bulletin and poster split to make. The filing counts 38,240 billboard displays, 1,928 of them digital, so static is 36,312. Billboard revenue is $1,391.4 million with digital billboard revenue of $434.3 million inside it, so static billboard revenue is $957.1 million [2].
Step 5, divide twice. Revenue over displays gives revenue per display per year, and dividing that by 13 gives the four-week period you actually buy. The blended headline is $3,405.2 million over 197,540 displays over 13, which is $1,326.
If you'd rather see the same method on a different question, it's what built our web design cost calculator.
Seven assumptions carry that table. Here's each one with its value.
- 13 four-week periods a year, from 52 divided by 4. The four-week period is the buying unit, and a calendar month is 4.35 weeks, so a month and a period are not the same thing.
- Lamar’s 5,500 digital displays sit inside its 79,600 bulletins. Derived in step 1 and checked in step 2 to one display.
- The 77% and 23% split applies to total billboard net revenue, digital included, which is what the filing says it applies to.
- Revenue equals what advertisers paid. Lamar reports net revenue, which is after agency commissions and therefore a little below the gross price, and OUTFRONT reports revenue. The two definitions are close and not identical.
- Vacancy is inside every figure. An empty display still counts in the denominator, which pulls all six averages below the price of a sold board.
- Production, printing and installation are excluded. They are billed separately and neither filing breaks them out.
- These are national portfolios, not markets. Neither filing prices a city, a road or a single structure.
Does a billboard cost more in a big market?
Almost certainly yes, and no primary source will tell you by how much. Neither filing publishes a rate for a city, a highway or a single structure.
The OAAA publishes format specifications with no rates at all, and tells advertisers to contact individual plant operators for availability [4]. So there is no sourced Chicago number and no sourced Las Vegas number, and you won't find one invented here.
What the filings do support is one proxy, and we are flagging it as a proxy in the same breath.
The two portfolios are weighted very differently. Lamar is in 45 states and Canada with a highway and exurban tilt [1]. OUTFRONT’s billboard revenue is concentrated in the largest metros, with Los Angeles alone at 14% of its billboard segment revenue and New York at 8% [2].
Set them side by side on the same basis and the gap is large. Across all static billboards, Lamar averaged $8,987 a display a year, which is $691 a period, against OUTFRONT’s $2,028 a period [1][2]. That's a factor of 2.93. On digital the gap narrows to 1.96, at $17,328 against $8,834.
Here's the honest limit on that. The gap mixes market size with inventory age, structure mix, contract mix and sales model, all of which differ between the two companies.
It gives you the order of magnitude a metro premium runs at, roughly two to three times on static inventory. It isn't a multiplier you can apply to your own city.
What billboard production and printing cost
No primary source publishes a dollar figure for billboard production or printing. The one production cost that is documented is zero, and it is on digital.
The OAAA states plainly that art files are very small and that there are no production or installation charges for digital billboards [4]. OUTFRONT’s filing says the same from the operator side, in the sentence where it explains why it keeps digitizing its portfolio: digital displays eliminate or greatly reduce print and installation costs [2]. Two primary sources, one conclusion. Buy digital and your production bill is the design, and nothing else.
Static is where the printing sits, and it is a separate bill from the media. A bulletin face is printed on one sheet of vinyl and stretched over the structure, and it has to reach the plant operator at least 10 working days before the posting date [5].
Posters run on single-sheet polyethylene or polypropylene and carry the same 10 working day delivery rule [3]. Extensions, the cutouts that break the frame, carry a one-time charge per square foot plus a monthly maintenance charge [5].
What none of those sources give is an amount. The OAAA publishes the specification and tells you to check with local out-of-home operators for market-specific rules [5], and neither filing breaks production out of its accounts. That's why every page you read quotes a different printing range, and why this one quotes none.
How much is a 30 second ad in Times Square?
Two sourced facts settle this better than a number would.
Start with the absence. No primary source publishes a rate for Times Square or for any single location, for the reason in the section above. Then take the format itself: a 30-second continuous spot is not how digital billboards are sold, because messages change every six to eight seconds, with typically six to eight advertisers sharing the same screen [4]. Thirty seconds of unbroken screen time is a television unit, not an out-of-home one.
Figures for Times Square circulate widely and we could not trace a single one back to an operator rate card, an SEC filing or the OAAA. So this post carries none. If you need a real quote for a specific screen, it comes from the plant operator that owns it. That is who sells digital billboards by specific location or by network, and who the OAAA points you to [4].
Why can nobody tell you one billboard price?
Because the people who could are not publishing, and the body that publishes is not pricing.
The OAAA issues specifications, sizes, contract lengths and artwork rules, and no rates [5][4]. Operators price structure by structure, so the number you get depends on the board you ask about, and permanent bulletins are priced individually on location and audience delivery [5].
The only public numbers with a traceable origin are portfolio averages.
Table 1 is one of those, which is exactly why every figure in it is an average, and not a price you could go out and pay today.
Is owning a billboard worth it?
On the revenue and operating side the answer is documented, and it's better than most people expect. An average OUTFRONT billboard display earned $36,386 in 2025 and cleared $13,831 of adjusted operating income before depreciation, amortization, interest and tax, a 38.0% margin [2].
That's per display, from the company’s own billboard segment accounts divided by its own display count. The line items underneath it are the useful part, because they're what you'd be paying.
| OUTFRONT billboard segment, 2025 | Segment total | Per display, a year | Per display, 4 weeks |
|---|---|---|---|
| Revenue | $1,391.4M | $36,386 | $2,799 |
| Property lease (ground rent) | $446.6M | $11,679 | $898 |
| Posting, maintenance and other | $149.3M | $3,904 | $300 |
| Selling, general and administrative | $266.6M | $6,972 | $536 |
| Adjusted operating income before D&A | $528.9M | $13,831 | $1,064 |
Every segment total is printed in OUTFRONT’s filing, and the four of them reconcile to the fifth: $1,391.4M less $446.6M less $149.3M less $266.6M is $528.9M. The per-display columns divide each by the 38,240 billboard displays the same filing counts [2].
Ground rent is the dominant cost, and the second filing backs that up at a very different weight.
Lamar leased approximately 71,500 outdoor sites in 2025 for an annualized lease expense of approximately $348.1 million, which it reports as approximately 17% of billboard advertising net revenues [1]. That works out at $4,869 a site a year, or $375 a period.
OUTFRONT’s billboard property lease ran at 32% of its billboard segment revenue [2]. Land in the biggest metros takes nearly twice the share of the rent it helps earn.
How expensive is it to own a billboard?
Three of the four costs you'd face are sourced in the table above: ground rent, posting and maintenance, and overhead. The fourth isn't, and it's the one you pay first.
Nothing in this post prices buying land, building a structure or getting it permitted, and no filing or OAAA page breaks those out. So we won't answer it with a number.
What you can take from the table is the steady state. An average big-operator display carried roughly $22,555 a year of rent, maintenance and overhead against $36,386 of revenue, and your own structure has to beat the land you put it on before any of that works.
Where this breaks
Eight limits, and the first three move the number most.
An average prices no single board. Every figure in table 1 is a portfolio mean. The board you want sits on a specific road with a specific audience, and that's what an operator quotes on.
Vacancy is in the denominator. Unsold displays earn nothing and still count, so each average sits below what a sold board goes for. Neither filing publishes an occupancy rate, so we can't tell you how far below.
The digital revenue figure has a second reading. Table 1 uses the $631.6 million the geographic table prints, which is 31.4% of Lamar’s billboard revenue, but the same filing says elsewhere that its 5,500 digital billboards generated approximately 33% of billboard advertising net revenues [1].
Read it at 33% and static bulletins come to $886.1 million instead, which moves that one average from $954 a period to $920. Nothing else in table 1 shifts, and we print the table figure because it is the one the filing states as a dollar amount.
Two operators aren't the market. Lamar and OUTFRONT booked $3,405.2 million of billboard revenue in 2025 [1][2], against the $9.1 billion the OAAA counted for all US out-of-home in 2024 [6].
Those are different years and different scopes, out-of-home being much wider than billboards, so read the 37% it implies as rough scale and nothing finer. Thousands of small independent plant operators aren't in this data at all.
Net revenue and revenue aren't the same definition. Lamar’s billboard figure is net of agency commissions and OUTFRONT’s isn't, so the two sides of the comparison are close without being identical.
The market-size comparison is a portfolio proxy. It rests on which markets each company happens to operate in, not on matched sites in the same city.
Production, printing and installation are outside every figure. So is the design, which the next section prices.
There's no CPM here. A cost per thousand impressions was the number we most wanted and couldn't build.
Geopath is the industry’s audience measurement body, and its impression data is market-specific and sits behind its member platform, not in a public table of typical impressions by structure type. Without published impressions by format, a CPM table would have been a guess wearing a decimal point, so we cut it.
What the design costs, and when it is not worth it
Design is the one line in a billboard budget that scales with nothing. The media cost moves by a factor of 38.8 between a poster and a digital bulletin, and the artwork is the same artwork. So the design share of your spend swings from most of it to a fifth of it, depending only on what you buy.
Set a month of Cluma’s own published price against each media figure from table 1, and put your own buy beside them. The Stage module is a flat $3,495 a month and covers posters, flyers, signage and out-of-home design, with print-ready files you hand to any printer [7].
| What you buy | Media, one 4-week period | Design, one month | Design as a share of the media |
|---|---|---|---|
| One four-week poster buy | $447 | $3,495 | 782% |
| One four-week static bulletin buy | $954 to $2,028 | $3,495 | 366% to 172% |
| One four-week digital bulletin buy | $8,834 to $17,328 | $3,495 | 40% to 20% |
Media figures are the averages derived in table 1 [1][2] and the design figure is Cluma’s list price [7]. Assumption, stated as one: a calendar month is 4.35 weeks against the media’s four, so a month of design buys about 9% more time than the period it sits beside. We haven't adjusted for it.
What the artwork has to carry is documented, even though its effect on results isn't. The OAAA’s guidance for bulletins is that efficient creative design is critical for visual impact and that a simple design gives the best impact [5], and for posters that a simple design with few words does [3].
On digital it's sharper. Build at actual pixel size, because copy that can't be read at that size can't be read from the street [4]. That's published guidance from the trade body, not a measured performance effect, and we found no primary source that measures one.
One layout also travels further than you might budget for. A rotary bulletin keeps running as the plant moves it to new locations roughly every 60 days [5], and posters get reposted every 60 to 90 days [3]. The same file earns across several locations and several periods.
For one poster or one small static buy, a subscription is the wrong instrument. At $447 of media, a month of design costs nearly eight times the media it decorates.
Buy a one-off layout from a freelancer, or from whoever already holds your brand files, and put the difference into more faces. The same goes for a single static bulletin, where the design still runs two to four times the media.
It changes above that line, where your media bill carries the design easily. On a digital buy the design is 20% to 40% of the spend, and a running arrangement earns its place when out-of-home is one of several recurring streams instead of a one-off.
For what SaaS teams spend on design overall, the sourced picture is in our SaaS design investment statistics. The buying models sit side by side in our guide to design subscriptions, and the rest of our data work is on the Cluma reports page.
If your billboard is one surface of a launch that also needs the booth, the signage and the deck, that's a running brief and not a single file. Cluma’s event and print design module handles posters, signage and out-of-home on one flat monthly rate, so the team that owns your product design owns the thing on the road too.
References
- Lamar Advertising Company, Form 10-K for the fiscal year ended 31 December 2025, filed with the SEC on 20.02.2026. Read 27.10.2026. Scope: Lamar’s billboard portfolio in 45 states and Canada, weighted toward highway and exurban markets. Source of the display counts, the 77% and 23% bulletin and poster revenue split, the $1,382.2M static and $631.6M digital billboard revenue, the 153,801 static displays in the geographic table, and the 71,500 leased sites at $348.1M. Limitations: narrative counts are rounded to the nearest hundred, the bulletin and poster split is given only as a percentage, the revenue is net of agency commissions, and the filing carries no occupancy rate and no rate card.
- OUTFRONT Media Inc., Form 10-K for the fiscal year ended 31 December 2025, filed with the SEC on 26.02.2026. Read 27.10.2026. Scope: OUTFRONT’s billboard segment, concentrated in the largest US metros. Source of the 38,240 billboard and 1,928 digital displays, the $1,391.4M billboard and $434.3M digital billboard revenue, the segment’s $446.6M property lease, $149.3M posting and maintenance, $266.6M SG&A and $528.9M adjusted OIBDA at a 38.0% margin, the four to five times statement, and the statement that digital eliminates or greatly reduces print and installation costs. Limitations: a metro-weighted portfolio is not a national average, bulletins are not split from posters, revenue is gross rather than net, and adjusted OIBDA is a non-GAAP measure.
- Out of Home Advertising Association of America, Posters, published 12.09.2022, read 27.10.2026. Source of posters bought in GRP programs typically in four to 52-week units, the 125in by 272in area, reposting every 60 to 90 days, delivery 10 working days before posting, and the design guidance on simple copy. Limitations: dated 2022, carries no prices, and the design guidance is the association’s stated view rather than a measured effect.
- Out of Home Advertising Association of America, Digital Billboards, published 12.09.2022, read 27.10.2026. Source of messages changing every six to eight seconds with typically six to eight advertisers per location, contracts from one week upward, the statement that there are no production or installation charges for digital billboards, the sale of digital boards by specific location or by network of locations offered by individual plant operators, the instruction to contact individual plant operators for availability, and the artwork guidance on actual pixel size. Limitations: dated 2022, no prices, and the production-charge statement covers charges levied by operators rather than the cost of creating artwork.
- Out of Home Advertising Association of America, Bulletins, published 12.09.2022, read 27.10.2026. Source of the live copy areas and spectacular sizes, rotary bulletins moved every 60 days, permanent bulletins priced individually with contracts generally six months or longer, vinyl supplied 10 working days before posting, extensions charged per square foot plus monthly maintenance, the instruction to check local operators for market rules, and the design guidance on visual impact. Limitations: dated 2022, carries no prices, and the extension charge is named with no amount.
- Out of Home Advertising Association of America, Out of Home Advertising Revenue Hits Record $1.98 Billion in Q1 2025, dated 3 June 2025, read 27.10.2026. Used here for one figure only, the record $9.1 billion of US out-of-home revenue in 2024. Labelled weak for the use it is put to: it covers whole-industry out-of-home across all formats rather than billboards alone, and it is a 2024 figure set beside 2025 operator revenue, so the 37% it implies is rough scale and not a market share. The association’s fuller annual report and member studies sit behind a lead form or a member login and could not be read, so no figure from them appears in this post.
- Cluma, uStage and pricing, both read 27.10.2026. Source of the Stage module at a flat $3,495 a month covering posters, flyers, signage and out-of-home design plus event presentations, print-ready CMYK files with correct bleed and resolution, one active request at a time with unlimited requests queued, the first month paid in full and then pause or cancel with no contract and no cancellation fee, and modules running $2,995 to $4,995 a month. Disclosure: Cluma publishes this post and sells one of the two options compared above. Cluma designs out-of-home creative and does not buy media, print or install.