



The median graphic designer salary in the United States is $62,960 a year, or $30.27 an hour, and the national range runs from under $39,520 at the 10th percentile to more than $104,910 at the 90th [1][3]. Half of US graphic designers earn less than that median and half earn more, so it's the number to budget a single hire against.
Those are May 2025 figures from the federal wage survey. They cover wage and salary employees only, and about 20% of graphic designers work for themselves, whose pay the survey doesn't collect [1]. So you're reading what employers actually paid, which is the right scope when you're the one paying.
Below is the full distribution, what entry level and senior work out to in dollars, where the ceiling sits, which states and metros pay the most, and what the salary costs you once employment costs go on top of it. Every figure names its source and its date.
What is the average graphic designer salary in the US?
The average graphic designer salary in the US is $70,560 a year and the median is $62,960 [1][3]. Both are right, and they answer different questions, which is why one page quoting an average and another quoting a midpoint will never agree.
A median is the middle of the distribution. A mean is the arithmetic average, and a smaller group of high earners drags it upward, so at $70,560 it sits $7,600 above the midpoint [3]. Hourly, the median is $30.27 and the mean $33.92 [1][3]. Both come out of the same federal survey of employer payrolls, taken in May 2025 across 197,830 graphic designer jobs [3].
Budget off the median when you're hiring one person into the middle of the market. Budget off the mean when you're sizing a whole team, because that's the figure a payroll total behaves like.
| Band | Hourly wage | Annual wage | What it tells you |
|---|---|---|---|
| 10th percentile | $19.00 | $39,520 | The bottom tenth of the market, and the floor on a junior offer |
| 25th percentile | $23.58 | $49,040 | A quarter of designers earn less than this |
| Median | $30.27 | $62,960 | The midpoint, and your default budget for one hire |
| Mean | $33.92 | $70,560 | The average, pulled up by the top of the range |
| 75th percentile | $39.34 | $81,830 | A quarter of designers earn more than this |
| 90th percentile | $50.44 | $104,910 | The top tenth, where specialists and expensive metros sit |
National wage estimates for graphic designers, May 2025 [3]. Annual and hourly figures are published separately, so multiplying one by 2,080 hours lands within about $6 of the other rather than exactly on it.
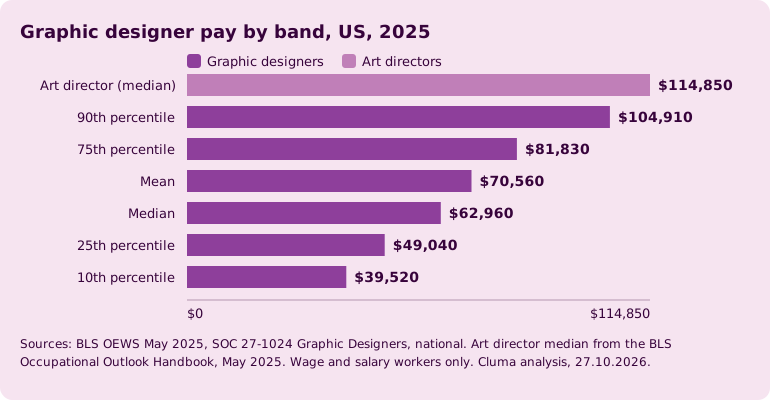
One scope note belongs with the table. The wage survey counted 197,830 graphic designers, while the federal projections programme puts the occupation at 253,100 jobs in 2025 [1][3]. The difference is the self-employed, who are in the job count and out of the wage survey you are budgeting against.
They are two different populations, so don't read one of those counts against the other.
What do entry level and senior graphic designers earn?
Government wage data publishes no seniority bands for graphic designers at all, so the honest answer is the percentile ladder: about $39,520 at the entry end, $62,960 in the middle and $104,910 at the senior end, with $49,040 and $81,830 marking the quarters in between [3]. The tier above the whole ladder is art director, a separate occupation with a median of $114,850 a year [2].
Reading percentiles as seniority is our call, and it is worth saying plainly that it is an approximation. A percentile is a position in the pay distribution, and what puts somebody there is a mix of experience, city, industry and employer size.
The platforms that do publish entry, junior and senior bands collect them from job postings rather than from a survey of employers. That's useful as a second opinion and it isn't a probability sample, so the table below keeps the two methods in separate columns instead of averaging them.
| Level | Federal wage survey, 2025 | Indeed, self-reported | Unit as Indeed publishes it | What the row rests on |
|---|---|---|---|---|
| Entry | $39,520 a year at the 10th percentile [3] | $19.43 | Per hour | A survey of employer payrolls, set against 6.2k Indeed job postings |
| Junior to mid | $49,040 to $62,960, the 25th percentile to the median [3] | $61,341 | Per year | Indeed labels this band Junior and gives it no year range |
| Senior | $81,830 to $104,910, the 75th to the 90th percentile [3] | $83,146 | Per year | The percentile pair is our reading, the Indeed band is Indeed’s label |
| Art director | $114,850 median, $64,900 to $213,050 across the range [2] | Not published on this page | n/a | A separate occupation code, not a graphic design seniority band |
Indeed’s own national figures put typical pay at $23.57 an hour across a range of $12.86 to $43.18, drawn from 6.2k salaries in job postings over 36 months and updated on 19 October 2026 [5]. We haven't converted any of it into an annual figure or blended it with the survey numbers, because the two sources count different things.
If you only take one line from this section, take this one. The ladder you can defend in your own compensation review is the percentile ladder, and the platform bands are a sanity check on it.
How much does the highest paid graphic designer make?
The highest paid graphic designers earn more than $104,910 a year, or $50.44 an hour, which is where the top 10% of the occupation sits [1][3]. Above that, the genuine ceiling is a different job title. Art directors have a median of $114,850 and the top 10% of them clear $213,050 [2].
Those two occupations are also moving in opposite directions. Art director employment is projected to grow 4% from 2025 to 2035, about 5,900 new positions on a base of 140,200 jobs [2].
So the pay ceiling inside graphic design is that $104,910 line, and the way past it is a move into art direction instead of another year in the same seat.
One lever moves pay further than the city does, and it's the industry you hire into. It swings the annual mean wage by $16,660, which is 63,780 - 47,120 across the four industries below.
| Industry | Annual mean wage, 2025 |
|---|---|
| Specialized design services | $63,780 |
| Information | $62,970 |
| Advertising, public relations, and related services | $61,200 |
| Printing and related support activities | $47,120 |
Top-paying industries for graphic designers, annual mean wage [1]. If you're a software company, the information row is the one your offer competes with.
Geography moves the number as hard as industry does. The District of Columbia pays the highest annual mean wage of any state-level area at $94,630, with California at $86,800 and Oregon at $85,140 behind it [3].
Only 13 of the 53 state-level areas in the survey sit above the national mean of $70,560. We pulled these rows from the same federal file as the percentile ladder above, not from a city page.
| State | Annual mean wage | Annual median wage | Designers employed |
|---|---|---|---|
| District of Columbia | $94,630 | $87,920 | 1,150 |
| California | $86,800 | $75,130 | 27,390 |
| Oregon | $85,140 | $66,040 | 4,140 |
| New York | $82,410 | $77,340 | 14,530 |
| Massachusetts | $79,690 | $76,710 | 4,450 |
| New Jersey | $79,430 | $73,790 | 5,670 |
| Rhode Island | $78,900 | $78,220 | 750 |
| Washington | $77,910 | $72,710 | 3,960 |
The eight highest-paying state-level areas for graphic designers, by annual mean wage, 2025 [3]. We rank on the mean because that is the measure the federal survey itself uses for its top-paying tables, and the median sits next to it so you can watch the two come apart. Fifty-three areas are published at this level, Puerto Rico and Guam included. Across the 50 states and DC the mean runs from $45,600 in West Virginia up to that $94,630.
Metros concentrate the money more sharply than states do. San Jose pays an annual mean of $107,360 and a median of $97,360, and it and San Francisco are the only two metro areas in the country where the mean for this occupation clears $100,000 [3].
| Metro area | Annual mean wage | Annual median wage | Designers employed |
|---|---|---|---|
| San Jose-Sunnyvale-Santa Clara, CA | $107,360 | $97,360 | 1,280 |
| San Francisco-Oakland-Fremont, CA | $102,130 | $92,050 | 3,870 |
| Portland-Vancouver-Hillsboro, OR-WA | $92,530 | $75,650 | 3,090 |
| Washington-Arlington-Alexandria, DC-VA-MD-WV | $89,540 | $85,420 | 4,420 |
| New York-Newark-Jersey City, NY-NJ | $85,950 | $79,280 | 15,160 |
| Santa Maria-Santa Barbara, CA | $84,370 | $78,500 | 210 |
| Boston-Cambridge-Newton, MA-NH | $82,350 | $78,270 | 3,560 |
| Santa Rosa-Petaluma, CA | $82,320 | $75,750 | 210 |
Ranked the same way, out of the 464 metro and nonmetropolitan areas carrying a published mean, 2025 [3]. Read the employment column first. Santa Maria and Santa Rosa rest on about 210 jobs each, so a handful of payrolls moves their mean, while New York-Newark-Jersey City carries 15,160 designers and California alone carries 27,390.
We kept both thin rows in the table rather than trim it down to the metros that look solid, and we dropped the self-reported city list this post used to carry, because an official ranking makes a job-postings one redundant.
So the market you hire in can matter more than the band you hire into. The gap between the highest and lowest state-level mean, $94,630 in the District of Columbia against $45,600 in West Virginia, is $49,030, which is more than the national 10th-percentile wage of $39,520 [3].
What does a graphic designer salary cost an employer?
A graphic designer salary of $62,960 costs a US employer about $89,951 a year, because benefits run 30.0% of total compensation across private industry, which is 42.87% on top of the wage [3][4]. Monthly that's $7,496, and hourly it's $43.25.
Here's the derivation, in full, so you can redo it on your own offer. Total employer compensation cost for private industry workers averaged $46.89 an hour worked in June 2026, of which wages and salaries were $32.82 and benefits were $14.07 [4].
Divide total compensation by wages, 46.89 / 32.82 = 1.4287, and that multiplier is the single rule behind every loaded figure below. So 62,960 x 1.4287 = $89,951. Of that, 89,951 - 62,960 = $26,991 is what you pay on top of the paycheck every year.
No published table carries that figure. It comes from putting two federal series together, and that arithmetic is the whole of the method here.
| Band | Annual wage | Employer benefits at 42.87% | Fully loaded, year | Per month | Per hour |
|---|---|---|---|---|---|
| 10th percentile | $39,520 | $16,942 | $56,462 | $4,705 | $27.15 |
| Median | $62,960 | $26,991 | $89,951 | $7,496 | $43.25 |
| Mean | $70,560 | $30,249 | $100,809 | $8,401 | $48.47 |
| 90th percentile | $104,910 | $44,975 | $149,885 | $12,490 | $72.06 |
| Art director, median | $114,850 | $49,236 | $164,086 | $13,674 | $78.89 |
Fully loaded employer cost by band. Wages from the 2025 national wage survey [3] and the art director median from the handbook [2], each multiplied by 1.4287 [4]. Cluma analysis, 27.10.2026.
Two assumptions sit in those columns and both are stated as assumptions. Monthly figures divide the annual by 12. Hourly figures divide it by 2,080 hours, which is the convention the wage survey itself uses, and you can check that on the published data: $19.00 an hour at the 10th percentile times 2,080 hours is exactly the $39,520 annual figure published beside it [3].
A one-line version you can run on any offer you're drafting: multiply the wage by 1.4287, and you have roughly what the hire takes out of your budget. For project work rather than a salary, the web design cost calculator prices the same decision by deliverable.
What the hiring market looks like in 2026
Supply moves against the usual story here. Graphic designer employment is projected to decline 2% from 2025 to 2035, a fall of about 4,200 jobs, and the stated reason is that automated design tools including AI are expected to make designers more productive [1].
That's a federal projection with federal reasoning behind it, not our forecast, and it sits next to a second figure that matters as much. About 16,000 openings a year are still projected over the decade, driven by people leaving the occupation [1].
Read together, those two numbers describe a market that keeps hiring without growing. Art direction grows 4% in the same window [2], so the senior tier is expanding while the base role shrinks.
For what SaaS teams are putting into design overall, the sourced design investment numbers sit beside this one, and the return side of that spend is its own article.
Where this model breaks
Eight limits, and the first two move the number most.
The benefits multiplier is economy-wide. No federal breakdown of employer benefit costs exists for a single occupation code, so 1.4287 is the average across all private industry jobs [4]. A design-specific load could run higher or lower, and the published data doesn't say which.
Hours worked are not hours paid. The multiplier comes from cost per hour worked, while the hourly columns divide by 2,080 hours paid, holidays and leave included [4]. Every hourly figure here is therefore a little low as the price of an hour of real design work.
The two halves of the calculation are a year apart. The wages are May 2025 and the benefit split is June 2026, so the multiplier is newer than the wages it multiplies.
Most of these figures are national. The state and metro tables are the exception, and the top of the metro ranking rests on employment counts as low as about 210 jobs, which makes those means less stable than the national bands. Price your offer against your own metro row where one exists.
The wage figures exclude the self-employed. They cover the roughly 80% of the occupation on a payroll [1], so freelance rates are a different question with a different answer.
The platform bands are self-reported. Indeed’s entry, junior and senior figures come from job postings, mix hourly and annual units in Indeed’s own presentation, and carry no published margin of error [5].
Art director is a separate occupation. It's the tier above on pay, and it isn't a guaranteed next step for any individual designer [2].
Recruiting, software, equipment and ramp-up are all outside these figures. We left them out instead of estimating them, which makes every loaded number here a floor rather than a full cost.
Hire a graphic designer or use a design subscription?
Hire when the design work fills a full week all year. Subscribe when it arrives in bursts. The useful way to compare the two is to put them on the same axis as everything above, which is the salary ladder, and that takes one division.
A subscription price is already a loaded cost, because there's no payroll tax or benefit bill behind it. So divide the annual price by the same 1.4287 multiplier and you get the salary that would cost you the same money.
| Option | Per month | Per year | Salary-equivalent | Where that lands |
|---|---|---|---|---|
| uCreate | $3,495 | $41,940 | $29,355 | Below the 10th percentile of $39,520 |
| uRun | $3,995 | $47,940 | $33,555 | Below the 10th percentile, by $5,965 |
| Both modules | $7,490 | $89,880 | $62,910 | $50 under the median wage of $62,960 |
Cluma’s published module prices [6], divided by 1.4287 [4] and set against the wage bands in the first table [3]. Salary-equivalents are rounded to the dollar, so 89,880 / 1.4287 reads as $62,910 rather than $62,910.34.
That last row is the honest comparison. Both modules together cost you almost exactly what one median designer costs, once the benefit load is on the salary.
What the money buys differs completely, though, and the difference is the decision.
One in-house designer gives you 40 hours a week of dedicated capacity, deep product context and somebody in the room when the roadmap changes. You also take on recruiting, ramp-up, the employment contract and the risk that the workload thins out before the year does.
Two modules give you two disciplines running at once, with one request in progress in each and an unlimited queue behind it, unlimited revisions while you subscribe, and work that is senior-owned and senior-reviewed [6]. Everyday graphic design tasks come back in about 48 hours, and bigger campaign sets move milestone by milestone with progress roughly every 48 hours.
Modules go on and off month to month, and a pause stops billing immediately and banks the unused days of the month you already paid for.
When the hire wins: your design work genuinely fills 40 hours a week for twelve months, you need someone with the product in their head rather than in a brief, and you want them in the standups. On that workload, a salaried designer is the better buy and nothing in the table above changes it.
When the work doesn't fill a week, the salary still runs every month anyway, and that's the pattern the subscription side is built for. For that side in detail, the comparison of ten services goes provider by provider, and the rest of our sourced numbers sit on the Cluma reports page.
If that's your pattern, a graphic design subscription is the version of this budget you can switch off: $3,495 a month for uCreate, $3,995 for uRun, $7,490 for both, and a pause that stops billing the day you take it.
References
- US Bureau of Labor Statistics, Occupational Outlook Handbook, Graphic Designers, May 2025 wage data and 2025 to 2035 projections, read 27.10.2026. Source of the median pay, the 10th and 90th percentile range, the 253,100 job count, the 20% self-employed share, the industry wage table, the 2% projected decline with its 4,200 job figure, the 16,000 annual openings and the automated design tools reasoning. Limitation: this page publishes only the 10th, median and 90th percentiles, so the quartiles in this post come from reference 3 instead.
- US Bureau of Labor Statistics, Occupational Outlook Handbook, Art Directors (SOC 27-1011), read 27.10.2026. Source of the $114,850 median, the $64,900 to $213,050 range, the 4% projection, the 5,900 new positions and the 140,200 job count. Limitation: art director is a separate occupation, used here as the tier above graphic design on pay rather than as a projected career step for any individual.
- US Bureau of Labor Statistics, Occupational Employment and Wage Statistics, national estimates for SOC 27-1024 Graphic Designers, 2025, from the LABSTAT public data file oe.data.0.Current (series OEUN0000000000000271024 with datatype codes 01, 03, 04 and 06 to 15). Source of the employment count of 197,830, the mean wages, all six hourly and annual percentiles including the quartiles, and the state and metro tables (series OEUS and OEUM for the same occupation, annual mean, annual median and employment). Downloaded and read twice on 27.10.2026, once when this post was written and once again independently when it was checked, with all thirteen national values matching to the dollar both times, against a Last-Modified of 15 May 2026. Limitations: the flat file publishes no margin of error beside each figure, and the metro estimates at the top of the ranking rest on employment counts as low as about 210 jobs, so those means are less stable than the national bands. The six hourly figures reproduce their published annual partners at 2,080 hours to within $6.40.
- US Bureau of Labor Statistics, Employer Costs for Employee Compensation, private industry workers, all occupations, June 2026 (Q2 2026), from total compensation, wages and salaries and total benefits cost per hour worked, all three re-read 27.10.2026 and all three showing Q2 2026 as the latest quarter. Source of $46.89, $32.82 and $14.07, and therefore of the 30.0% benefit share, the 42.87% load on wages and the 1.4287 multiplier. Main limitation: this series is published for all private industry occupations together and not for graphic designers, so an economy-wide multiplier is being applied to a design-specific wage.
- Indeed, Graphic designer salary in the United States, read 27.10.2026. Source of the $23.57 typical hourly pay, the $12.86 to $43.18 range and the entry, junior and senior bands. Limitations: 6.2k salaries taken from job postings on Indeed over 36 months and updated 19 October 2026, which is job-posting data and not a probability sample, with no published margin of error, and Indeed mixes hourly and annual units across its own level bands. Used here as a labelled secondary cross-check and never converted into or averaged with a government figure.
- Cluma, graphic design subscription and pricing, both read 27.10.2026. Source of the uCreate, uRun and combined module prices and of the subscription terms quoted in the comparison. Disclosure: Cluma publishes this post and is one of the two options in that table, on the same footing as the hire.
Two sources turned up during the research and stayed out on purpose: the national salary pages at Glassdoor and ZipRecruiter, neither of which could be accessed. Neither is estimated or interpolated anywhere above, and no figure in this post comes from a stat roundup, a vendor summary or an AI answer.